

“The Grid defines a new balance between control and de-control in which the city can be at the same time ordered and fluid, a metropolis of rigid chaos,” said architect Rem Koolhaas about New York City’s urban planning. The Museum of the City of New York, after its celebrated 2011-2012 exhibit, Greatest Grid: The Master Plan of Manhattan, 1811-2011, has launched an interactive, online version of the exhibition that has just been released. If you’re a lover of maps, vintage photos, history, urban planning or New York, you must check out this website.
Also, be sure not to miss our co-sponsored event with the Museum of the City of New York, City on a Grid: How New York Became New York tonight at 6:30pm. Untapped Cities readers get a special discount using code MCBC1 for $10 tickets (regularly $16). Now, since we’ve already compiled a list of fun facts to learn about the original 1811 Commissioner’s plan and discussed the history of the grid planning, take a look below to discover how you can interact with the Museum’s new website to find out even more about this revolutionary period in Manhattan history.
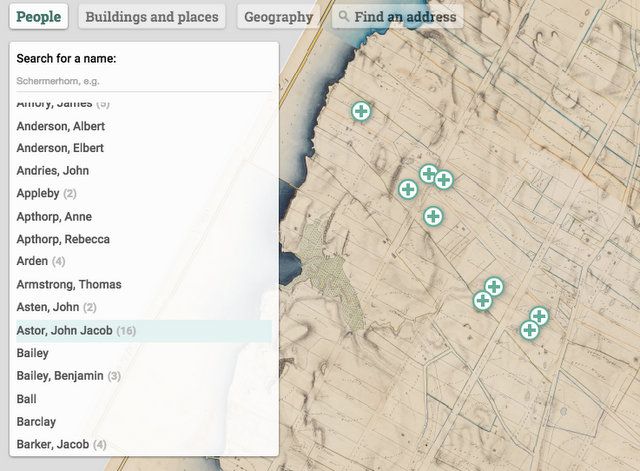
Screenshot of “Before the Grid,” looking at John Jacob Astor’s plots of land
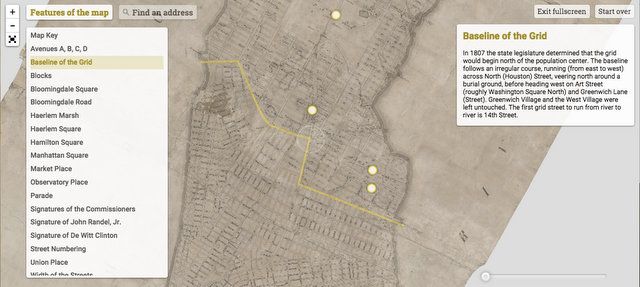
Screenshot of “Interactive 1811 Plan,” looking at the baseline of the grid
The first of the interactive maps the site offers is “Before the Grid,” which outlines the city prior to 1811. This map marks out various influential people, geographical locations and landmarks from Manhattan’s earlier years. We took a look at John Jacob Astor‘s early plots of land and the Museum reports that upon reflecting on his life in the city, Astor said, “Could I begin life again knowing what I now know and had money to invest, I would buy every foot of land on the island of Manhattan.”

Simeon De Witt’s drafting tools, 1790–1830. Unidentified maker, probably English. Shagreen, silver, ivory, steel, and brass
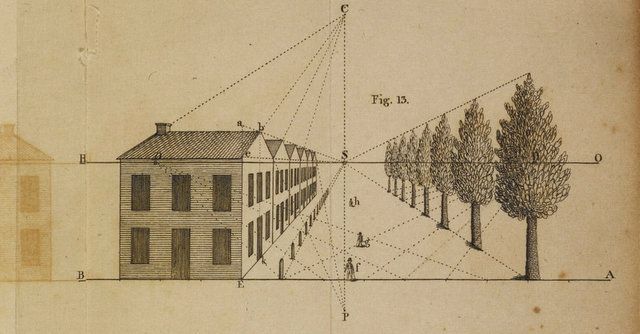
Page from Simeon De Witt, “The Elements of Perspective”
The site then travels into the 1811 planning of the grid. According to the site, the plan came out of necessity after the city’s rapid population expansion – “between 1790 and 1810, Manhattan’s population tripled to just under 100,000.” Thus, in 1807, the Commission had to map out a plan to control the city’s structure in relation to its ever-rising population. The exhibit allows viewers to click on a number of city plans and key documents used in the making of the grid, including the tools and maps of perspective that Simeon De Witt, one of the early city surveyors, used during his time.
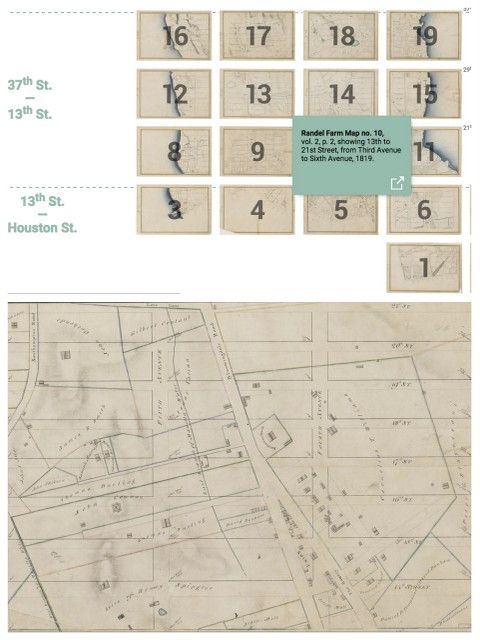
Screenshots of John Randel Jr.’s atlas of 92 watercolor maps
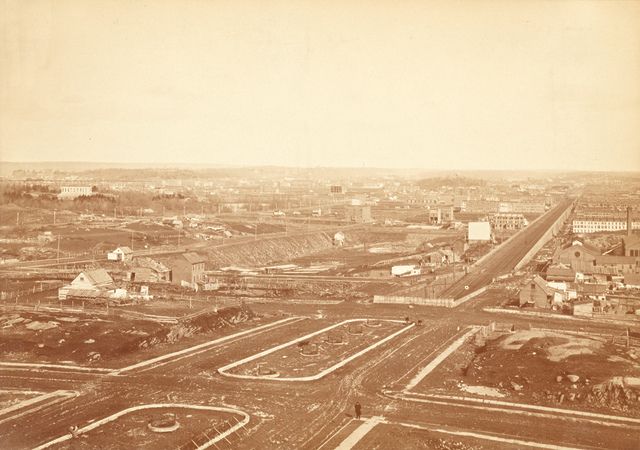
Peter Baab, Photographic series from the roof of George Ehret’s home at Park Avenue and 94th Street, 1882–83
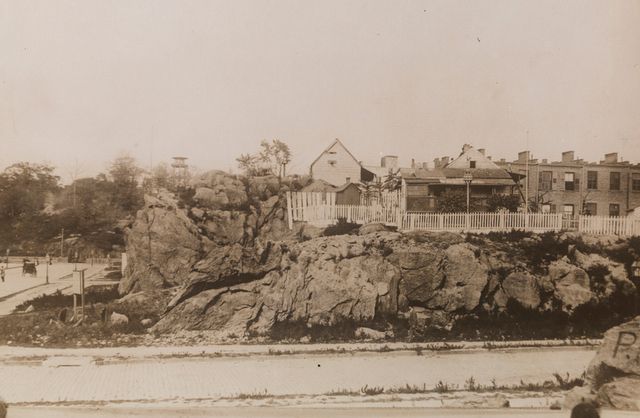
Fifth Avenue and 118th Street, 1894, Gelatin silver print on printing-out paper
Next, we journey to the 60 year construction period of the grid. The site offers an extensive look at how: John Randel, Jr. conducted surveys of the land; the construction of the grid; and how plots were auctioned and purchased. Randel had created an atlas of “92 watercolor maps that vividly illustrates the properties, old roads, and major features of pre-grid Manhattan as well as the future location of the new streets and avenues of the 1811 grid.” The site allows you to look at the collective whole these atlases created or you can click on an individual plot to see its intricacies. There are also vintage photos of the clearing of roads and pictures of Manhattan with its natural landscape still intact.
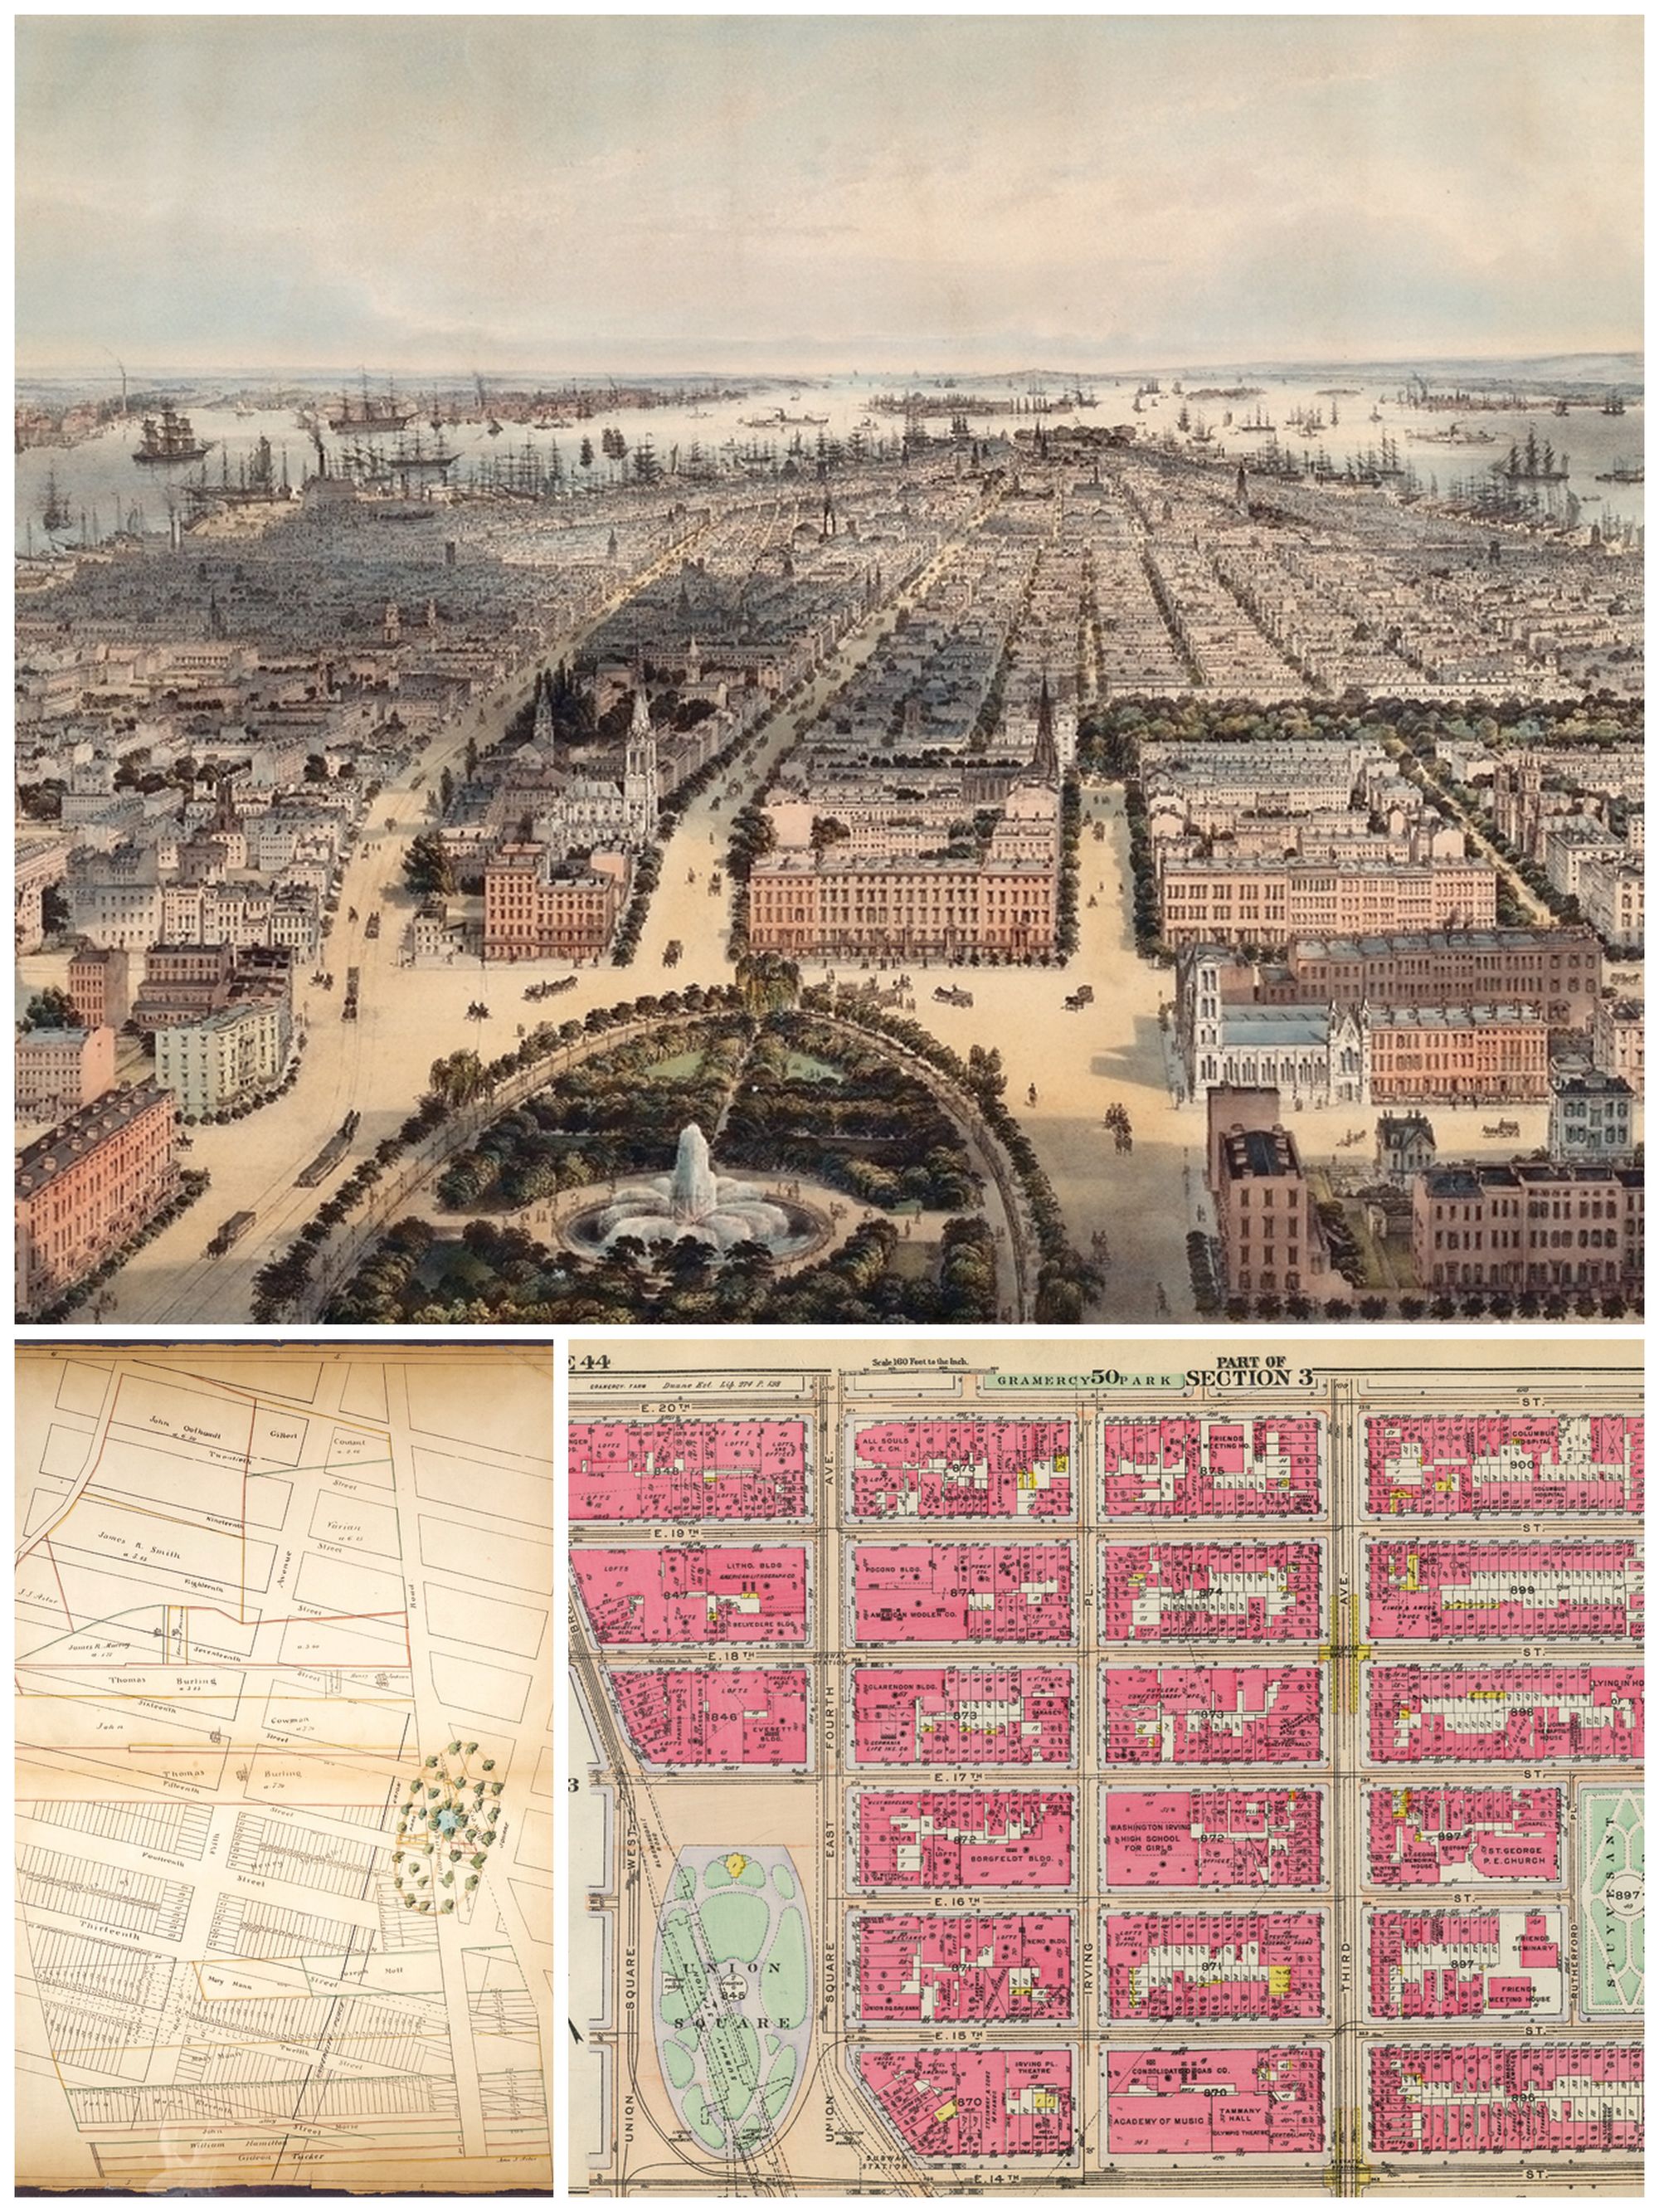
Maps and plans of Union Square area. Top: View South, 1849; Bottom left: 1868; Bottom right: 1916
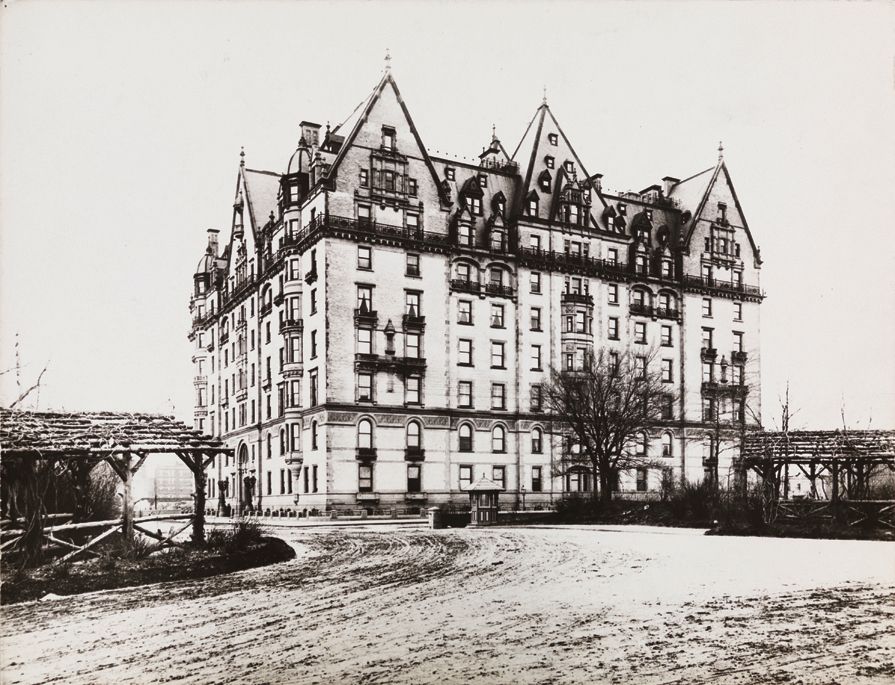
Dakota Apartments, 1985
After the establishment of the city’s grid, we begin to see the development of the city in both the 19th and 20th centuries. The site allows you to trace the construction and evolution of various New York landmarks. The above collage looks at the plans for the Union Square area. There’s also a photo of the historic Dakota Apartments in 1895, just 11 years after being constructed.
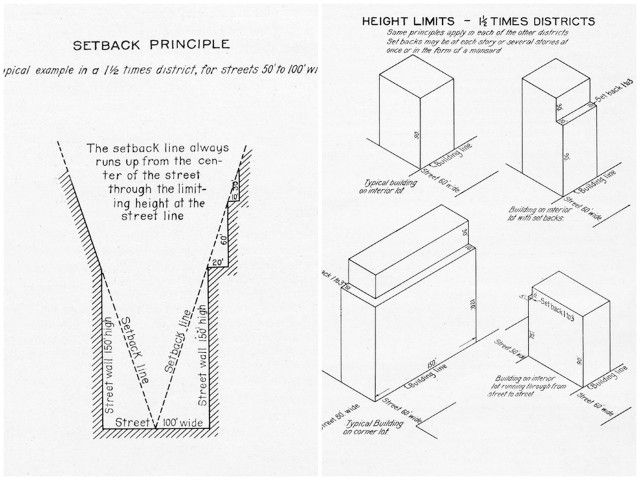
From George B. Ford, “New York City Building Zone Resolution,” restricting the height and use of buildings and prescribing the minimum sizes of their yards and courts
Finally, the site offers a look from the 20th century until now. You can take a closer look at New York’s first zoning law of 1916 viewing the entire landscape of the city in 3D to better visualize the upward construction.
There is a great deal more to be learned and gained from this site and we highly recommend exploring it for yourself. However, if you want some quick fun facts about the 1811 Commission see our finds examing the commissioner’s grid up close in person at the Library of Congress or read more about its history from this book review.

