


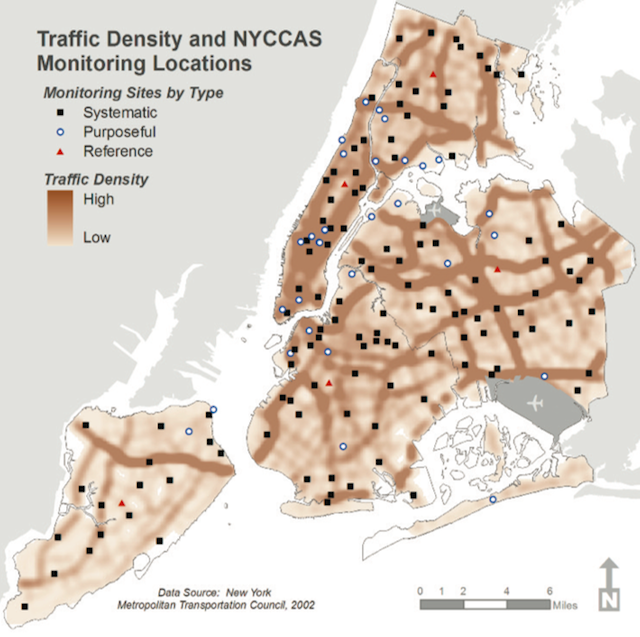
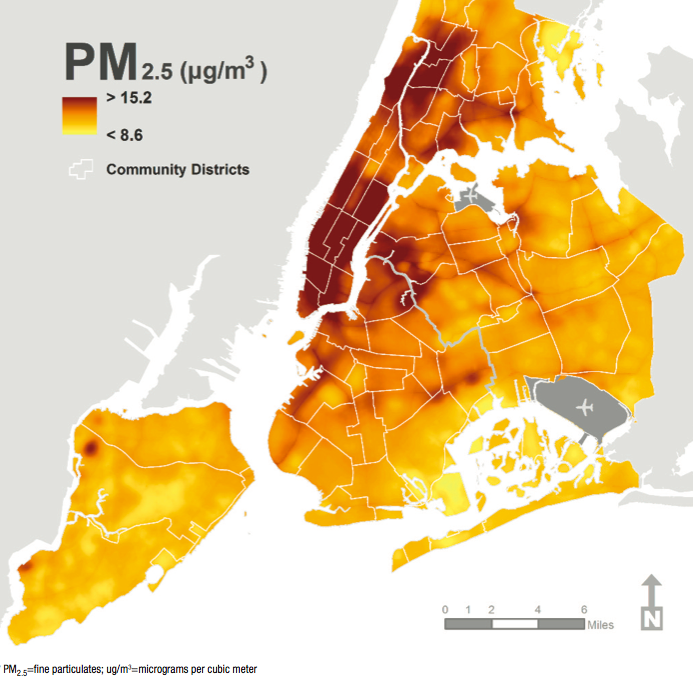
One component of New York City’s comprehensive planning vision, PlaNYC, was the creation of the New York City Department of Health and Mental Hygiene’s New York City Community Air Survey (NYCCAS). It measured street-level air pollution at 150 locations from 2008-2009 and 100 locations from 2010-2013. The first year’s 150 locations are displayed on the map above.
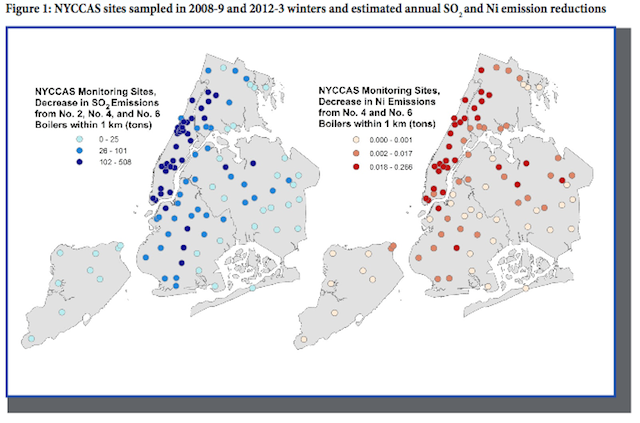
From the report: “Results from the first year of monitoring (2009) showed that levels of air pollutants important to public health, specifically fine particles (PM2.5), sulfur dioxide (SO2) and nickel (Ni), were higher in areas that have high density of buildings with boilers burning fuel oil, particularly residual fuel oil (grades No. 4 and No. 6 heating oils).”
Below are the maps that display these findings and make a strong case for moving to Staten Island:
Nitric Oxide Trends: 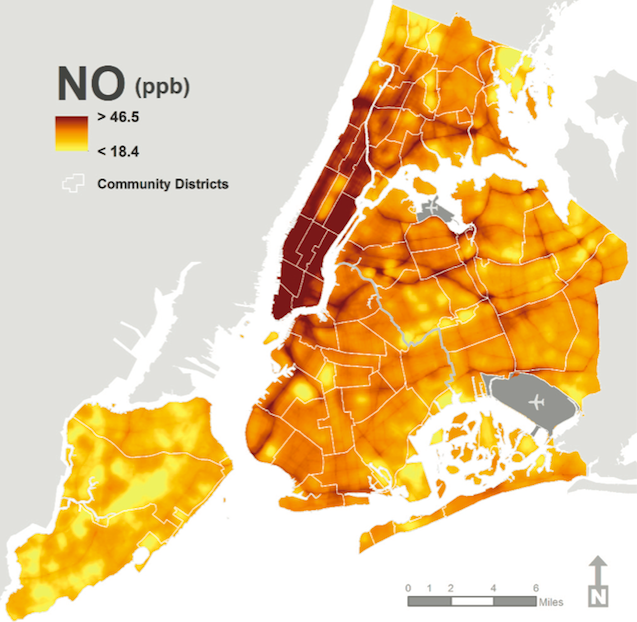
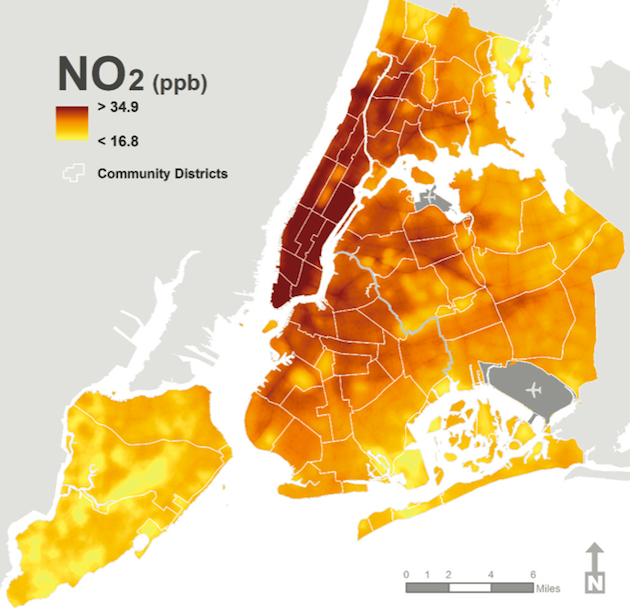
Nitric Dioxide Trends:
Fine Particle Trends:
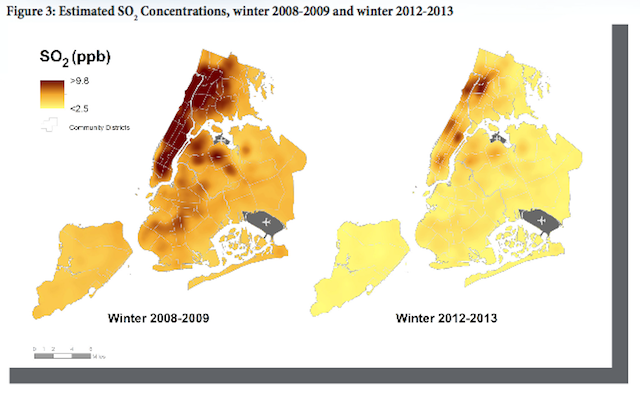
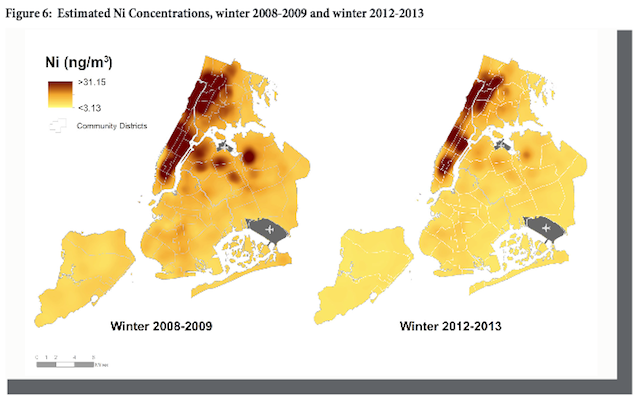
All that brown doesn’t look like good news. But encouragingly, the Survey ended up finding major reductions in pollutants by 2013. In fact, the Survey reported that NYC in 2013 had the cleanest air in 50 years. The reductions are chalked up to PlaNYC’s targeted regulation of heating sources.
“As of winter 2012-2013, wintertime SO2 levels have declined by 69% while levels of nickel in fine particulate matter (an indicator of residual oil combustion) have declined by 35%. In addition, routine regulatory air monitoring… has recorded a 23% improvement in annual average city-wide PM2.5 concentrations in 2009- 11 relative to 2005-2007.
Below find the maps comparing displaying the decline in pollution:
 The Survey report is available here.
Get in touch with the author @youngzokeziah. See more maps in our Fun Maps column.