Map makers Constantine Valhouli and Cat Callaghan have been behind some of the Fun Maps we’ve featured on Untapped Cities, like tracking the Beat Generation and mapping every song referencing NYC. For his latest work, Valhouli tells us he was hoping to take a break from the typical heat map to show “in a more accessible way how New York City housing prices are really disparate,” and how there are “surprising pockets of affordability” that show up using this type of map versus a more conventional visual format.
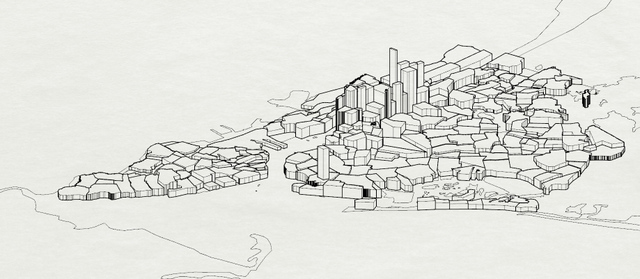
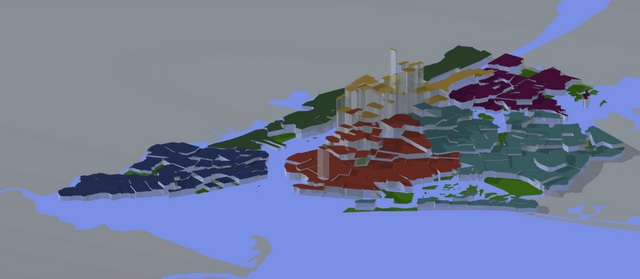
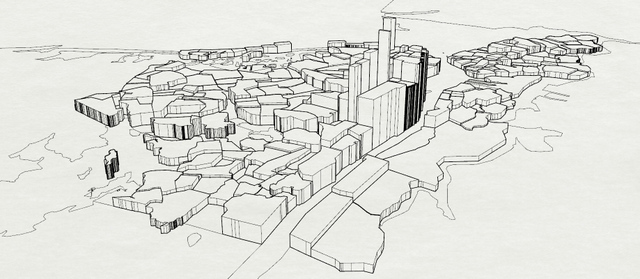
The maps include both hand-drawn and digital versions with the height of each neighborhood’s section representing the cost of property per square foot.
According to Valhouli,
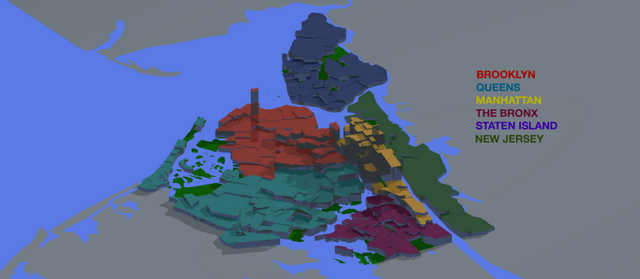
“For us, the map was a way to explore the oft-repeated figure that the average apartment price in NYC is $1.3-1.6M, and that it’s over $1,200/sq.ft. Based on the data we looked at (which averaged information from Zillow, StreetEasy, and Trulia), housing prices in NYC range from under $150/sq.ft. to over $3,000/sq.ft. (and much higher, in the cases of some of the pockets of ultraluxury buildings seen on the map).”
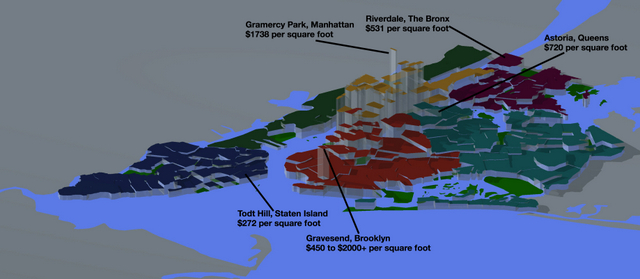
One interesting finding is in Gravesend, Brooklyn, where homes in a Sephardic Jewish community between Avenue S to Avenue U skyrocket to prices higher than $2,000 per square foot because of their proximity to synagogues and Jewish community centers.
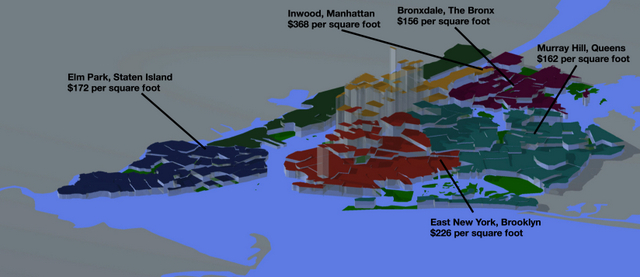
Below is a map of some of the least expensive neighborhoods in the New York City metro area.
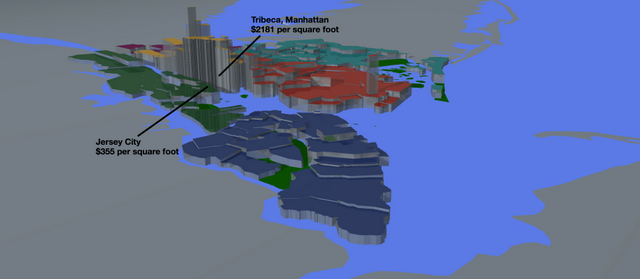
The maps allow for interesting juxtapositions. The below map shows Jersey City and Tribeca. Both neighborhoods allow for a commute to midtown Manhattan in less than 15 minutes, yet Tribeca’s property costs soar at $2,181 per square foot, in contrast to Jersey City’s at $355.
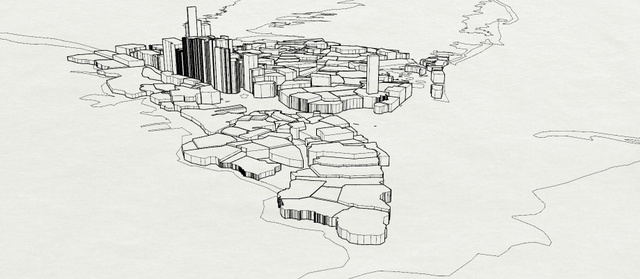
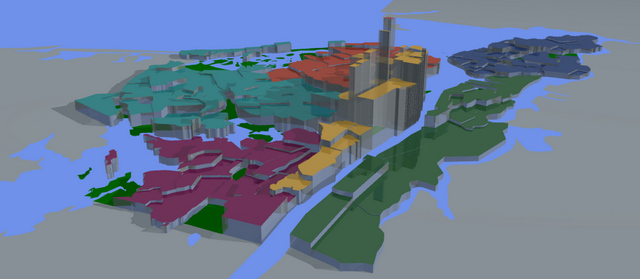
View looking south, digital and hand-drawn versions:
Our coverage of Constantine Valhouli’s other maps:
Fun Maps: The Beat Generation in NYC, Across the Country, and France
Fun Maps: Original Dutch and Native Names of NYC Neighborhoods
Check out our Fun Maps column.
Contact the author @brooklynbonanza.