
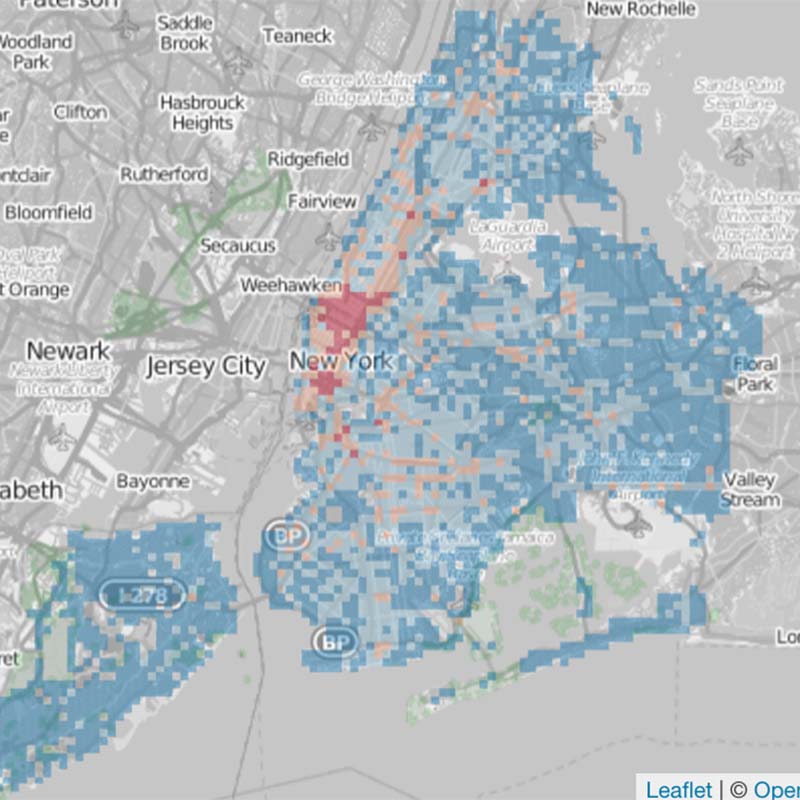
 Traffic Accidents in NYC by Area cluster
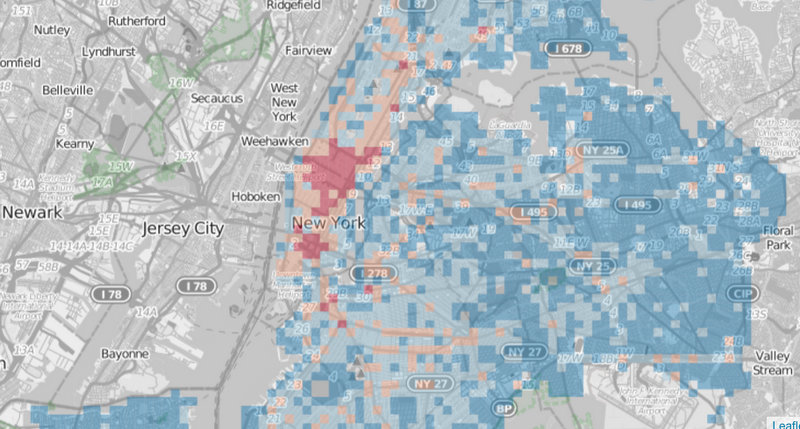
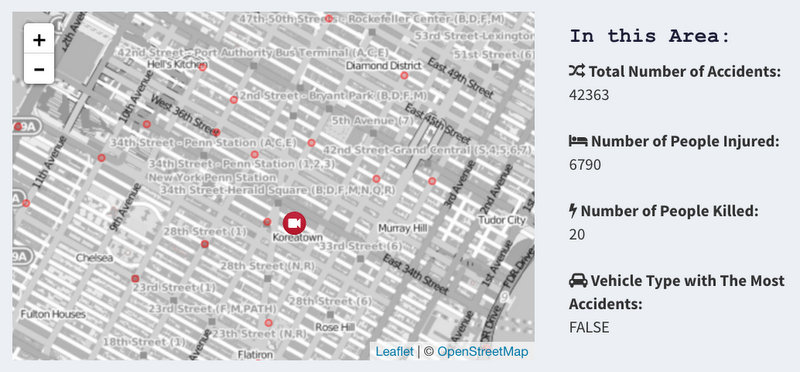
As New York City’s Zero Vision policy comes under fire after a recent release of hit-and-run data, the Columbia University student project “Traffic Care” is more than timely. It uses data from New York City’s open data portal from 2013 to 2016 to visualize accident data by area near a user supplied location. Within this geographical frame, data such as number of accidents, number killed, vehicle type, time of accident and live traffic cams can be viewed. The app also forecasts the incidence of future casualties. The students who produced this project, Chencheng Jiang, Yiwei Sun, Skanda Vishwanath, Guanzhong You and Yunyi Zhang, write that it is “aimed at helping policy makers to make informed decisions.”
The students had three weeks to create their app, similar to the water complaint app we covered earlier this year, and Associate Professor of Statistics, Tian Zheng, who leads the class tells us more functions could certainly be developed. Yet, you can see some distinct patterns already. The highest concentration of accidents are taking place in Midtown and Downtown Manhattan.
Check out more on the Traffic Care web app. Next,see a Fun Map about NYC’s Abandoned Subway Stations and Lost Subway Lines.