

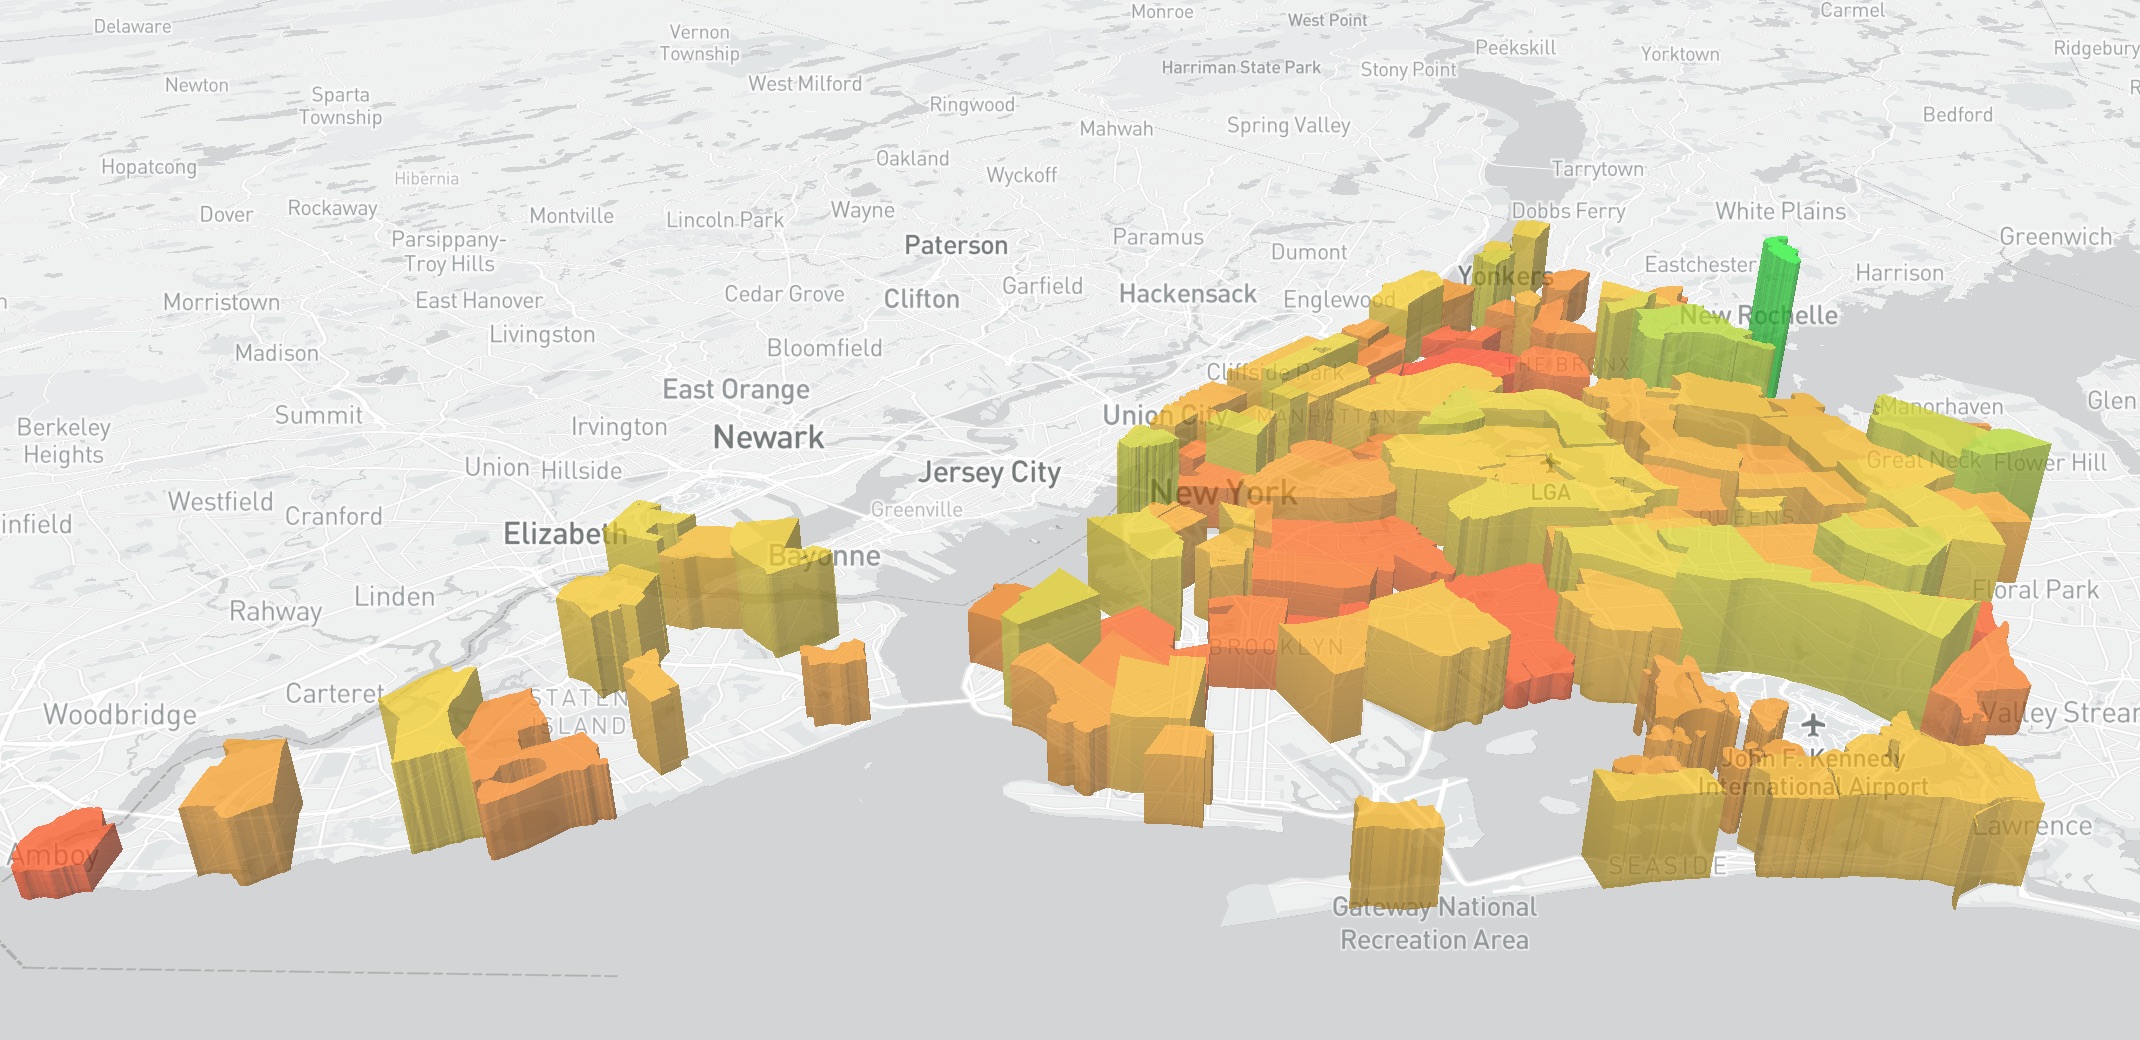
Depending on where you live in New York, you either spent the past year meeting with your coworkers over Zoom — or stuck with “connection unstable” warnings. We’ve mapped New York used end-user speed test results from 5.2 million data points taken throughout 2020, so you can see exactly which neighborhoods and boroughs had the fastest (and slowest) internet during Covid-19.
 Data visualizations in this post are based on collaborative analysis of Measurement Labs open speed test data by Fair Internet Report and ConnectCalifornia.
Speed test average varied widely throughout New York during 2020. The fastest neighborhood as measured by median average result was City Island in the Bronx, clocking in at 113 Mbps. The slowest was West Farms, also in the Bronx, at only 14 Mbps average across 2020.
Covid impact on NYC speed tests
The mass move to work-from-home for major companies in New York City had major implications for network usage. Prior to the pandemic, high-density high-capacity office buildings were tailored specifically for large workforces, and located in areas with abundant fiber access, both commercial and privately leased.
Once Covid lockdowns started, this workforce (about 1.2M workers in Manhattan alone) spread out into high-density low-capacity residential areas — not a scenario network architects anticipated.
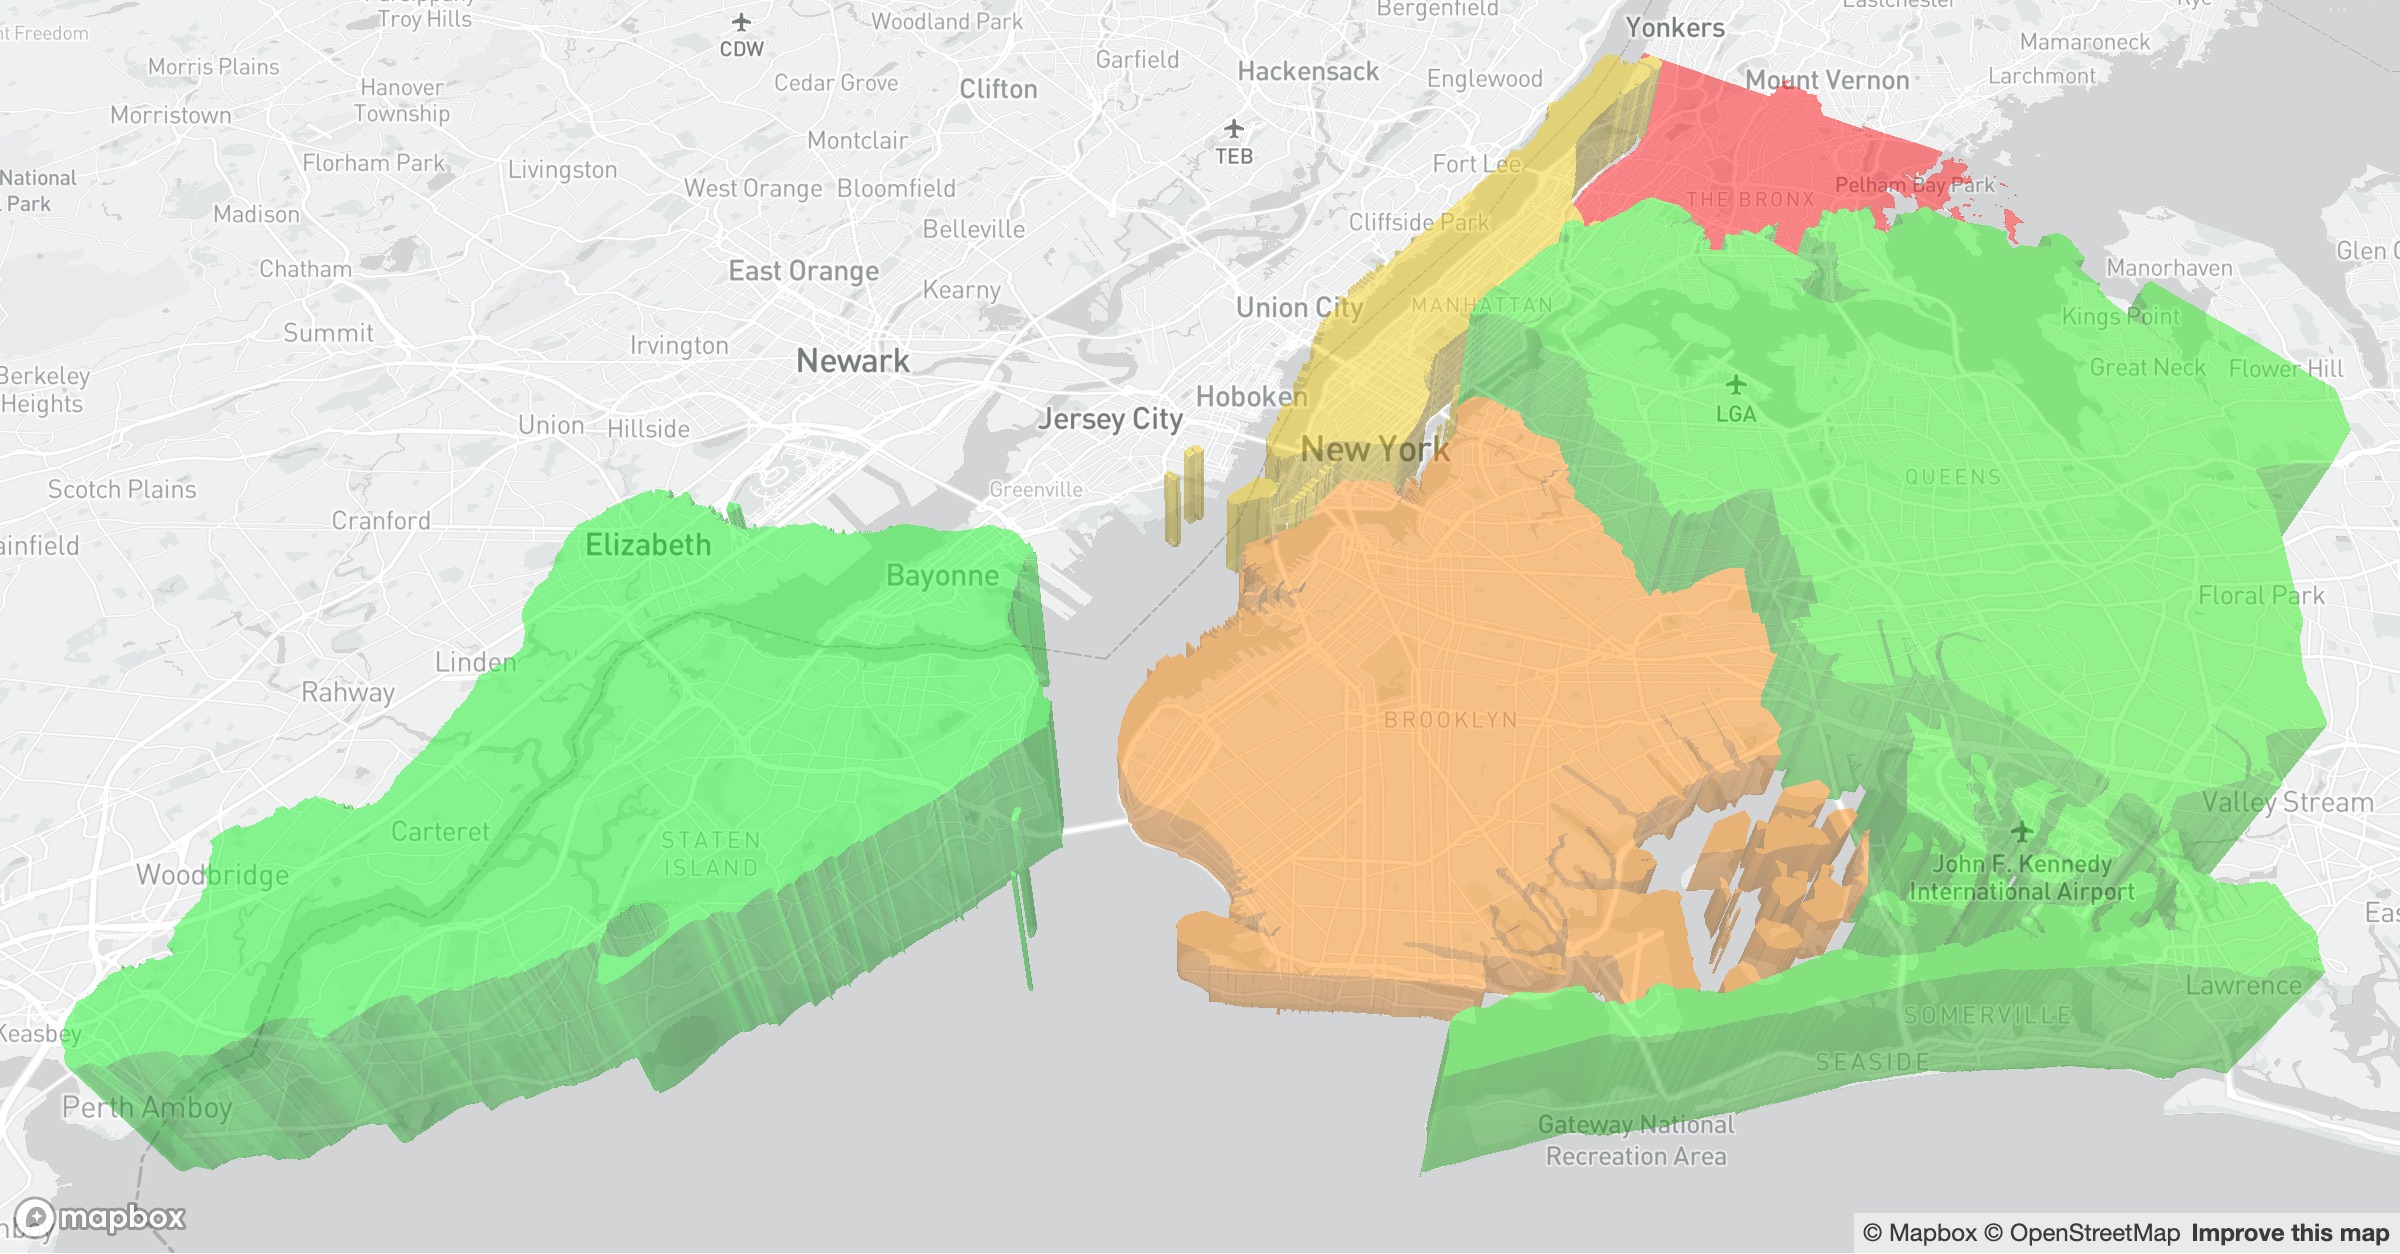
 2020 saw wide variations in speed test performance throughout 2020, overall trending up as local ISPs worked to account for the massive move to Work-From-Home.
As shown in this map animation, there were wide fluctuations in speeds over the year in residential areas, overall trending up as ISPs worked to account for the change in usage.
Internet Speeds by NYC Borough
The fastest borough overall was Staten Island with a median average speed test of 60 Mbps, almost double the results for the slowest borough, the Bronx (36 Mbps).
 At a high level, boroughs known for single-family homes and fiber-to-the-home service outperformed boroughs dominated by MDUs and residential towers.
Results by borough from fastest to slowest were:
- Staten Island: 60.33 Mbps average speed, 220,310 tests recorded
- Queens: 58.81 Mbps average speed, 1,197,282 tests recorded
- Manhattan: 48.93 Mbps average speed, 1,090,921 tests recorded
- Brooklyn: 44.29 Mbps average speed, 1,744,113 tests recorded
- The Bronx: 36.05 Mbps average speed, 628,384 tests recorded
Internet providers commonly concentrate on wealthier neighborhoods first when deploying fiber, to ensure high subscription rates to pay back the up-front investment of installing fiber lines and running drops to buildings. These results aren’t a big surprise since Staten Island is the wealthiest borough in New York City — and wealthier neighborhoods have a tendency to receive better services. As of 2019, the average household income in Staten Island was $82,783, about 50% higher than in the lowest-earning borough (Brooklyn).
In New York, Fios has faced criticism and even a lawsuit from the city for failing to provide citywide access, as required in their franchise agreements. As of 2021, fiber access still varies from street to street, resulting in high result variation between neighborhoods.
Neighborhoods with the fastest internet speeds by borough
Thanks to the patchwork nature of fiber deployment throughout New York City, your experience depends largely on the specific neighborhood and building you’re in. Some boroughs fare better than others, but even within boroughs test results show substantial variation on the high and low end. For New Yorkers with poor home internet quality, the culprit is often oversubscription: the practice of placing multiple customers on shared lines. This system works fine when most people are away from home or offline most of the time… which obviously wasn’t the case in 2020, as the global pandemic drove global data usage up 47%.
Aside from the Work From Home impact, increased residential download for entertainment purposes also drove network strain; even before the pandemic, the fact that home network usage for HD and 4K video had ballooned to more than 50% of traffic was becoming a major issue. Thankfully, New York is well-equipped with data centers (40 major data centers as of 2021), which pipe popular video content directly to local networks. Next, we will look at internet speeds within boroughs.
Manhattan
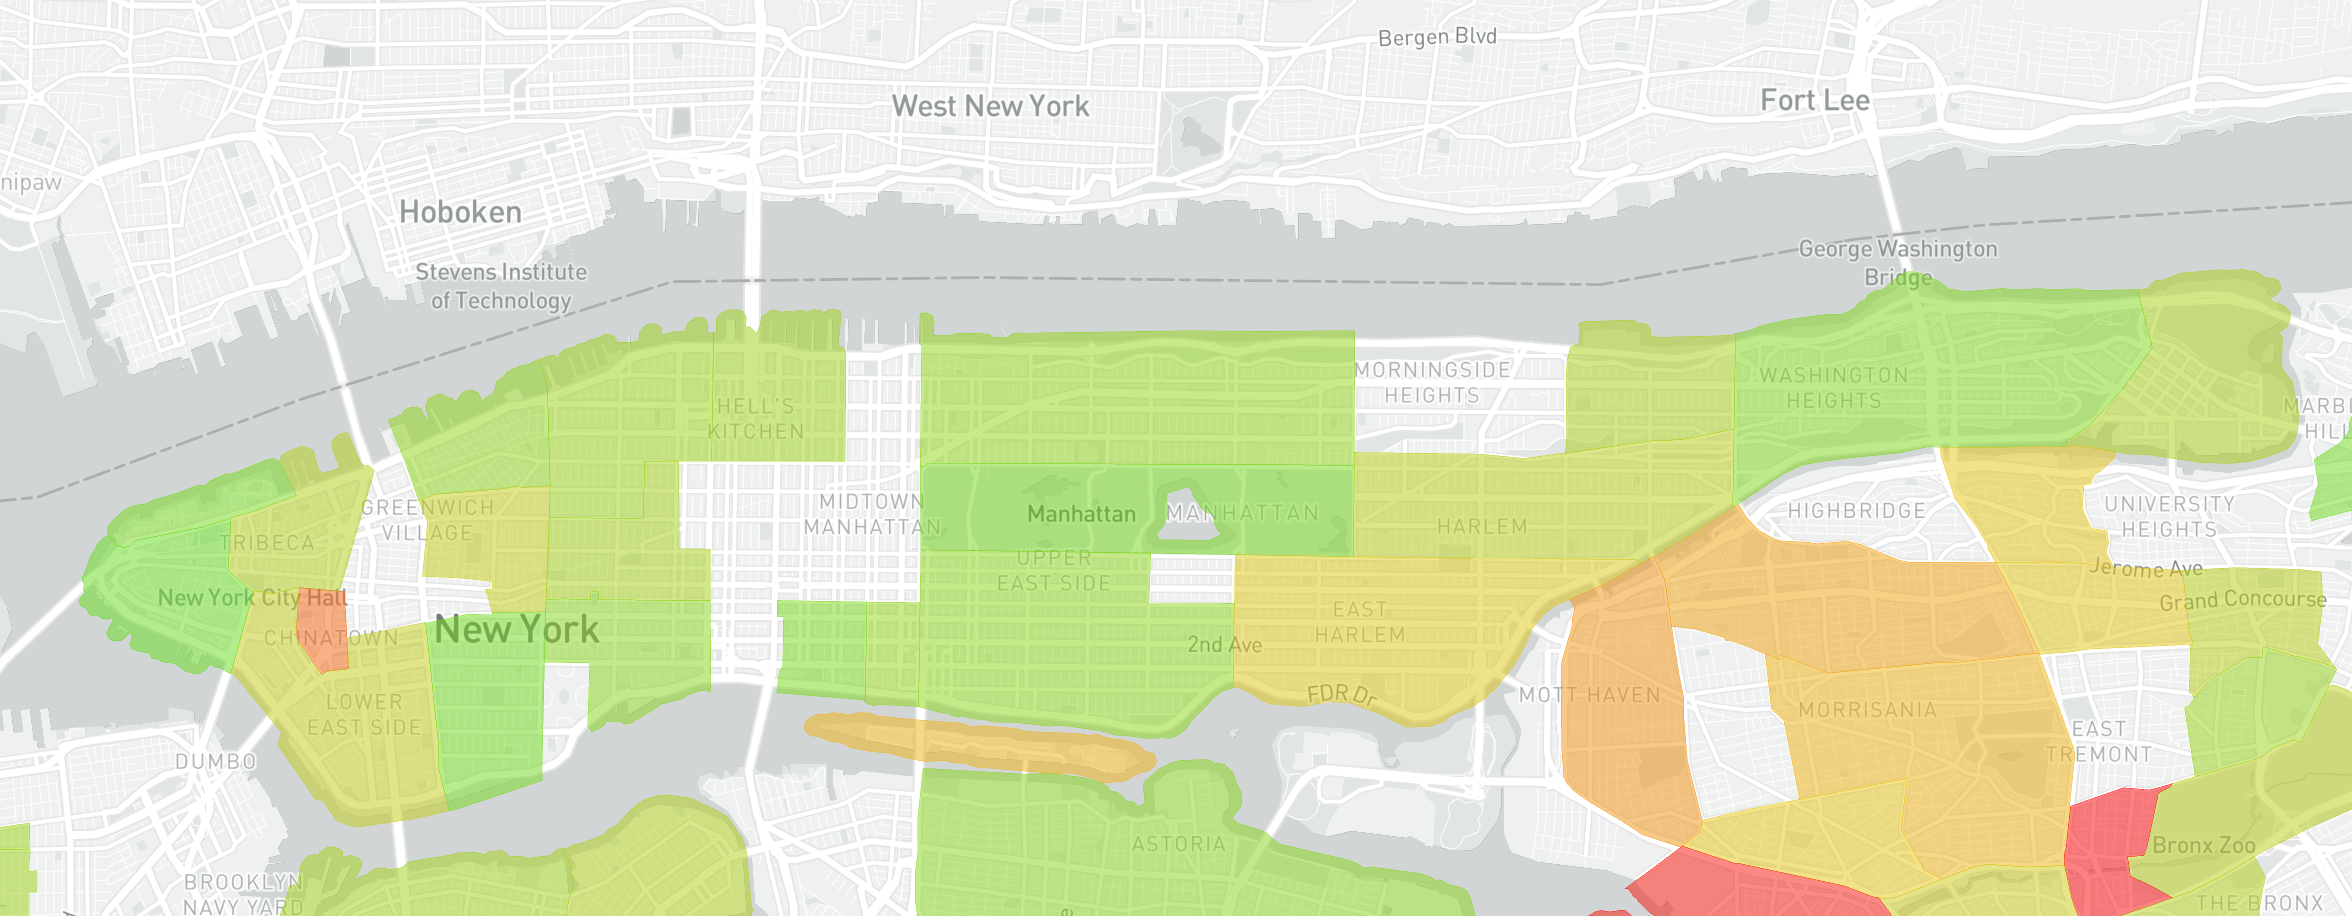
- Fastest neighborhood: Downtown, 74 Mbps median average speed test result.
- Slowest neighborhood: Chinatown, 19 Mbps median average speed test result.
Manhattan has strong speeds across neighborhoods, although some areas with older buildings and older wiring like Chinatown and the Lower East Side perform somewhat lower. Manhattan has strong availability of enterprise and dark fiber for business purposes. Providers specialized in the borough like Stealth Communications are known for having some of the fastest enterprise connections in the US.
Brooklyn
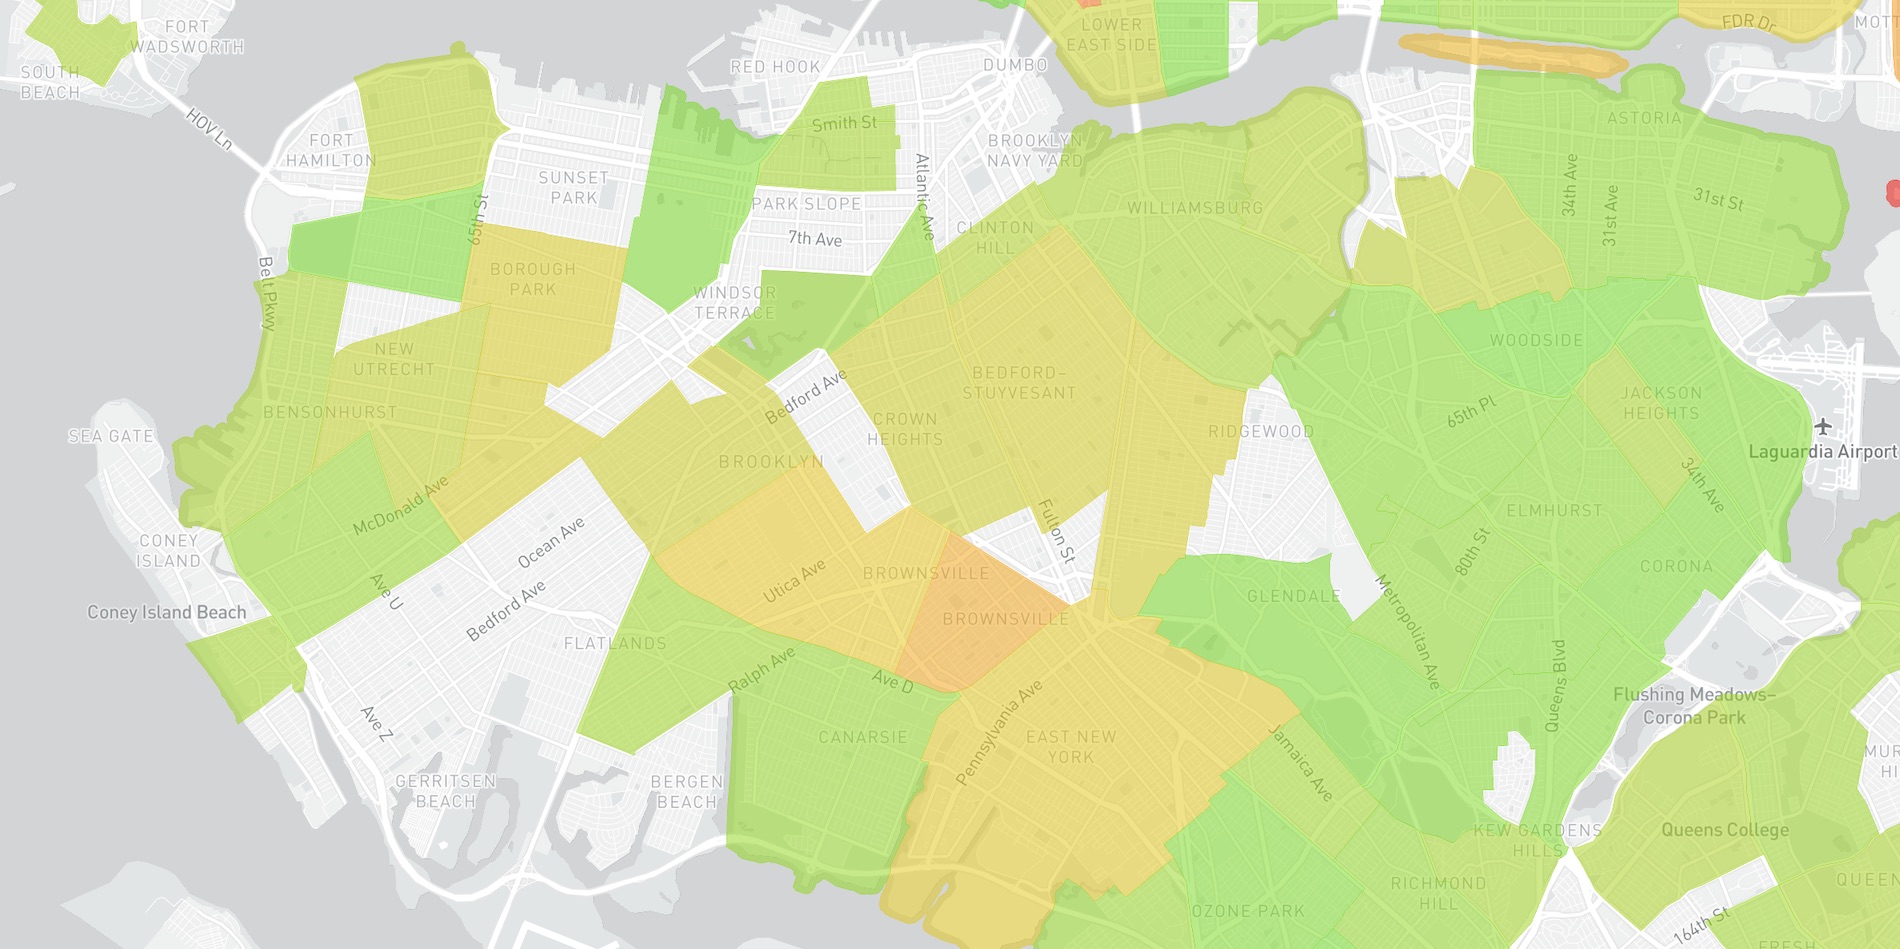
- Fastest neighborhood: Dyker Heights, 67 Mbps median average speed test result.
- Slowest neighborhood: Brownsville, 24 Mbps median average speed test result.
Brooklyn tests were overall a step down from Manhattan. While there are more row-houses and access to units for fiber providers like Verizon is less of an issue, reaching units can be problematic compared with areas like Queens or Staten Island that have more single-family homes. As you can see above, “trendier” areas like Williamsburg tend to have faster speeds than lower-income neighborhoods further from Manhattan.
The Bronx
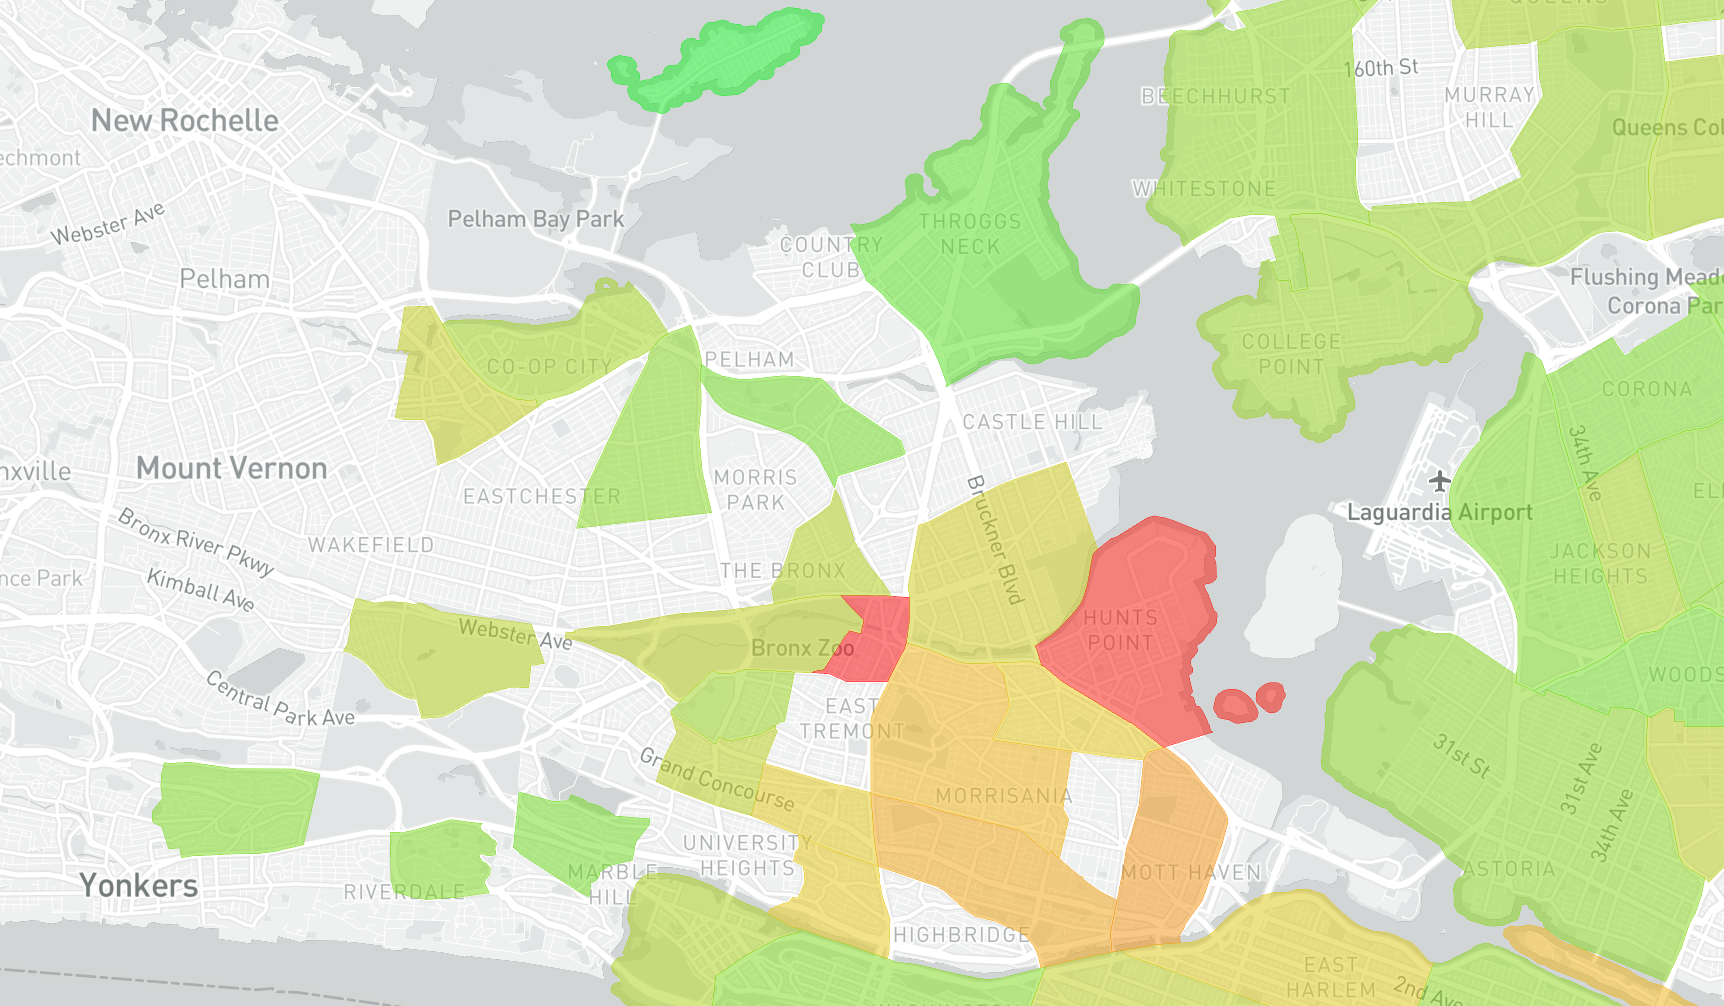
- Fastest neighborhood: City Island, 113 Mbps median average speed test result.
- Slowest neighborhood: West Farms, 14 Mbps median average speed test result.
The Bronx showed a high level of fluctuation from month to month compared with other areas in New York, as shown in the animated map above. The Bronx also had the highest-performing neighborhood in 2020, City Island, one of the only neighborhoods where tests averaged above 100 Mbps for all of 2020.
Queens
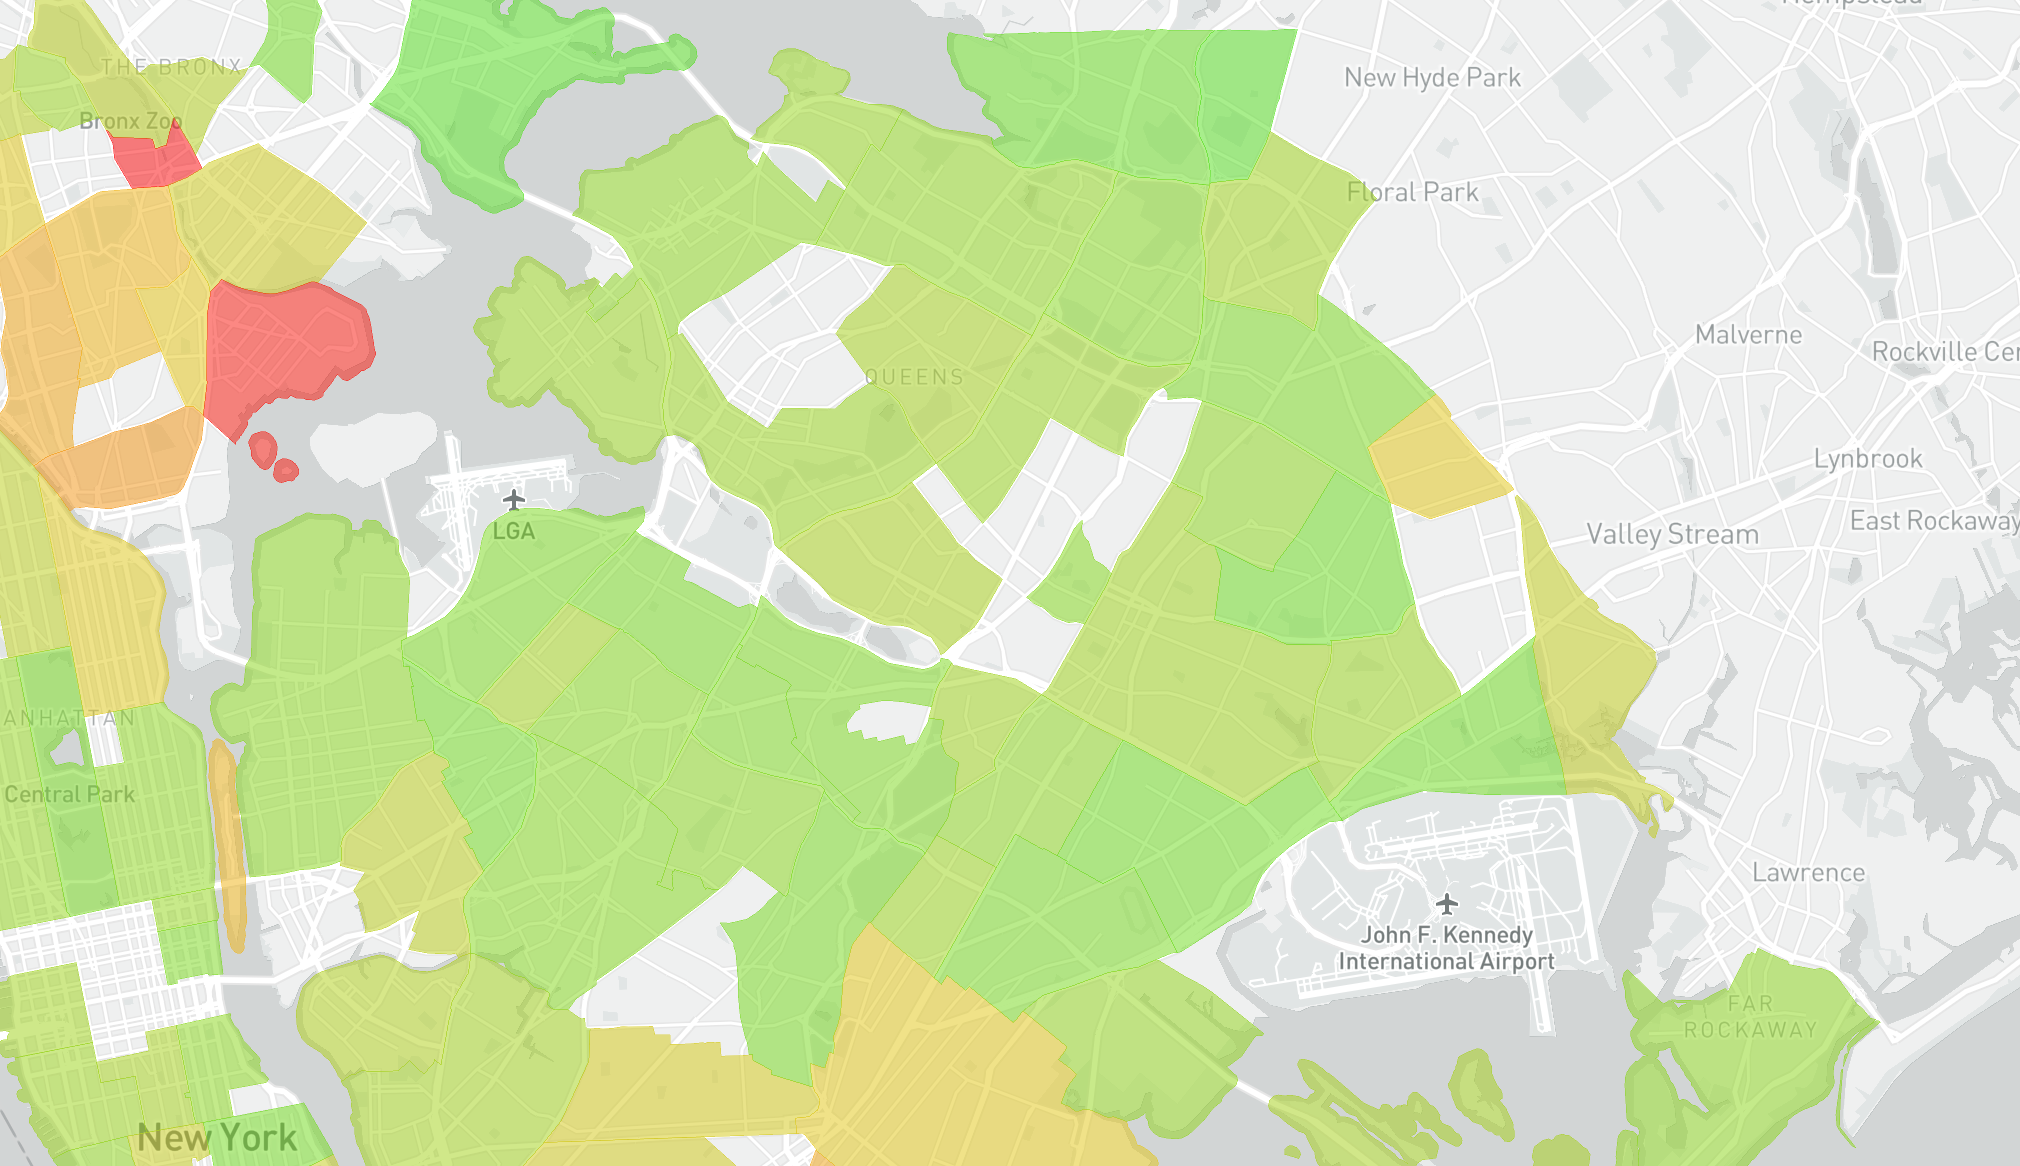
- Fastest neighborhood: Glen Oaks, 79 Mbps median average speed test result.
- Slowest neighborhood: Cambria Heights, 29 Mbps median average speed test result.
As expected for an area with many single-family homes, Queens performed well overall. In fact, 88% of neighborhoods where we could located tests showed averages above 50 Mbps, which is double the FCC’s requirements for modern broadband internet.
Staten island
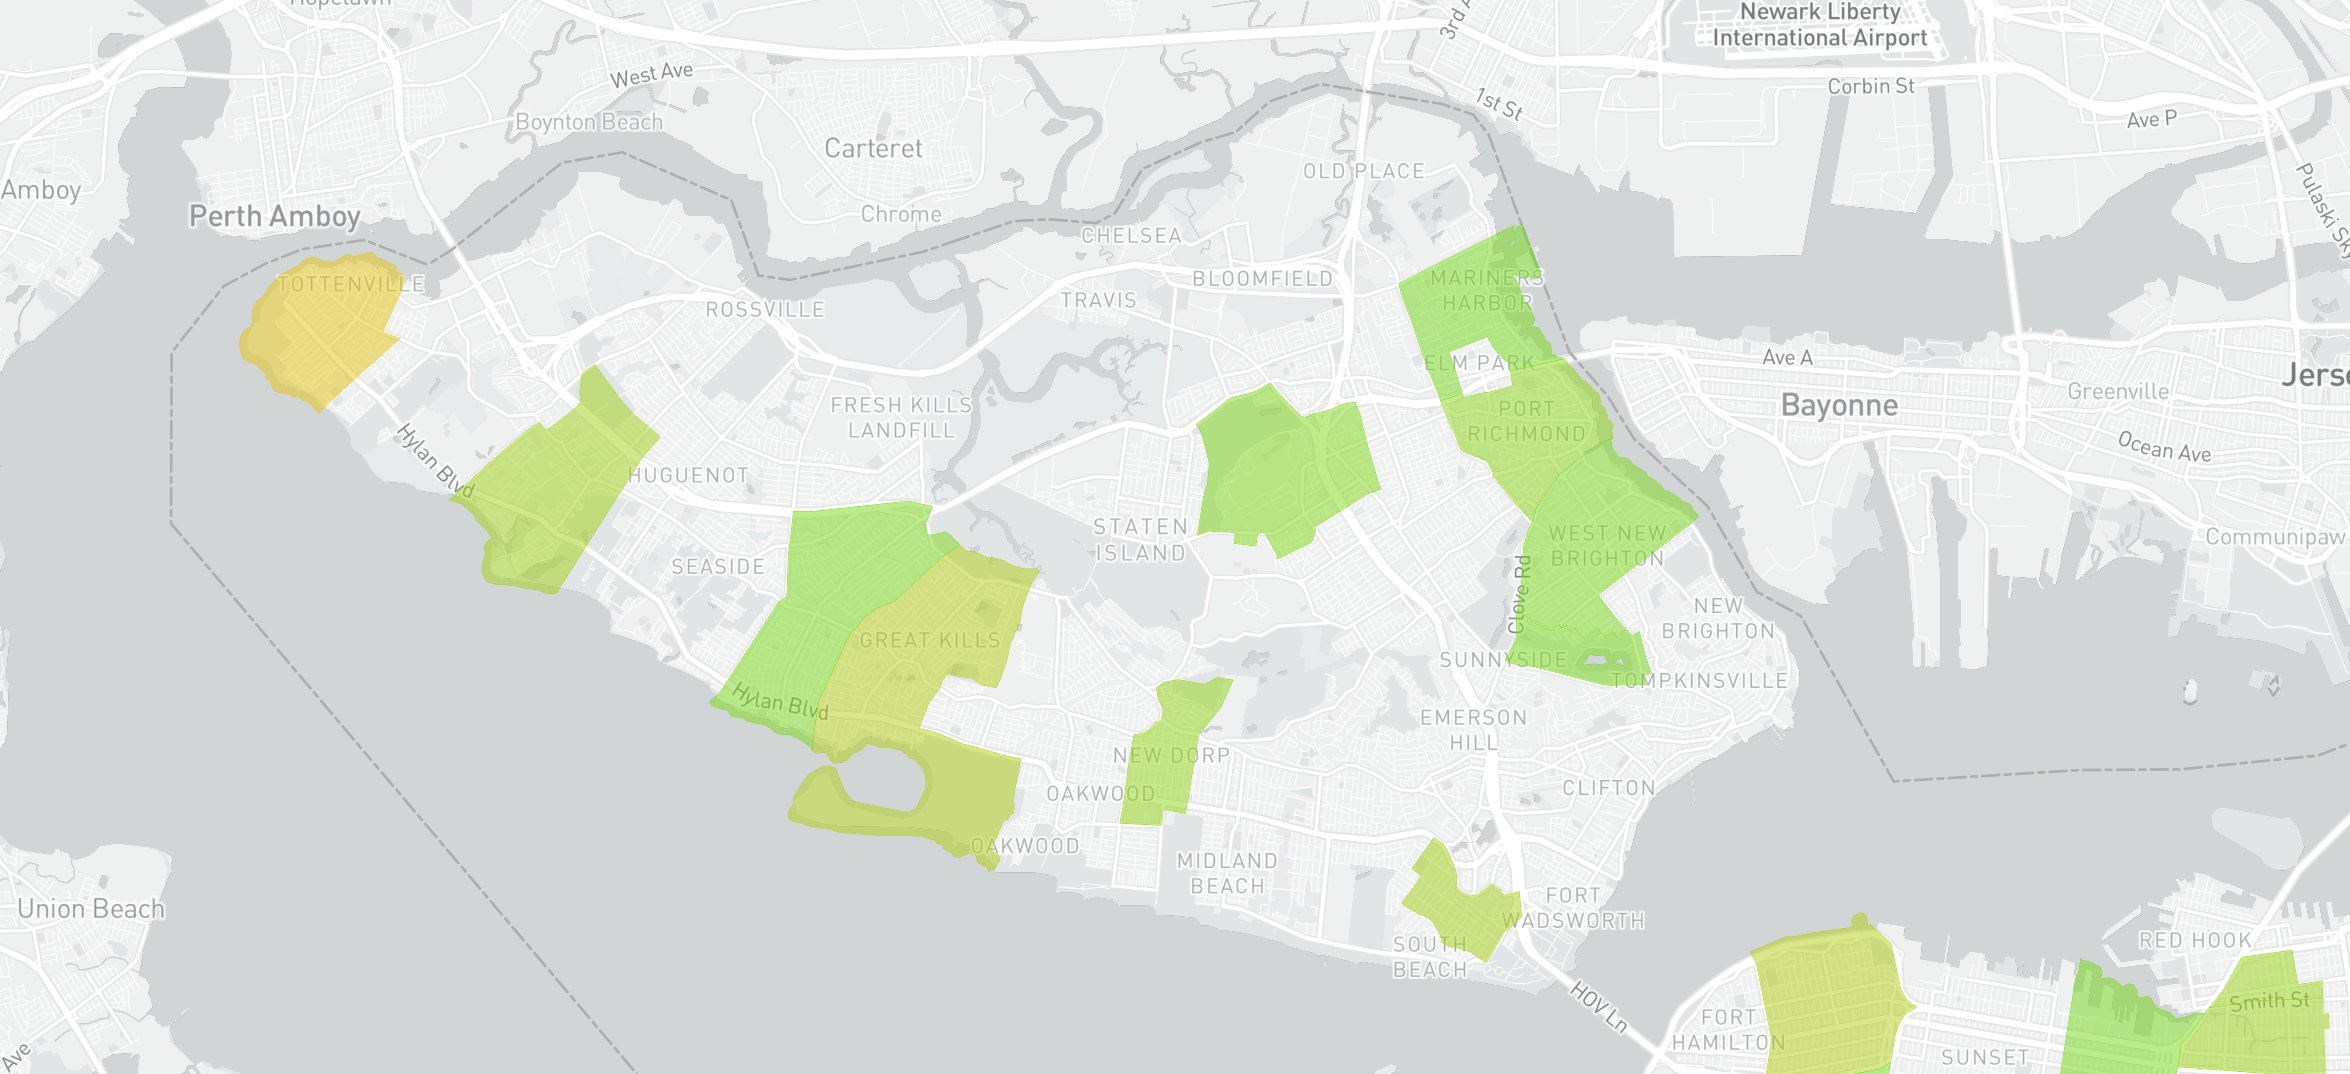
- Fastest neighborhood: Mariner’s Harbor, 66 Mbps median average speed test result.
- Slowest neighborhood: Tottenville, 29 Mbps median average speed test result.
Due to issues with geo-locating tests, we were only able to collect reliable data for a handful of neighborhoods on Staten Island.
However, tests collected performed well relative to the rest of New York, due largely to high availability of fiber to the home services from Verizon Fios and relative scarcity of apartment buildings and MDUs, which tend to drive down speed tests due to internal wiring issues.
Will NYC Internet speeds improve in 2021?
Covid-19 has drawn renewed government attention to the need for home broadband access in the American economy. Instances of schoolchildren doing homework from McDonalds parking lots and students dropping classes due to lack of internet access have gone from an obscure issue to a national embarrassment for the US, particularly when speeds have compared poorly to other developed countries for years.
However, the situation has been improving. New York City internet speeds overall improved from an average of just 15 Mbps at the beginning of 2020 to almost 40 Mbps in Q4. While much of this gain was likely driven by homes being forced to upgrade their plan tier to account for all-day video calls, there has been a surge of public interest in the topic, which is expected to drive investment and additional government subsidy programs in 2021.
In New York specifically, governor Cuomo has committed $2 billion in funds to digital development for schools, while Mayor de Blasio pursued a settlement with Verizon that promises to hold them accountable for completing 500,000 home connections required by their franchise agreement with the city.
Methodology
To produce visualizations, we first collected and tagged tests according to IP address, and used open data from MaxMind to attach test groups to locations within New York City. Tests were processed to identify and remove effective zero and repeat tests, which are common from network testing or diagnosis of LAN issues.
Averages cited and visualized are median averages, to provide a more realistic representation of consumer experience by neighborhood rather than a representation of total bandwidth available to an area, which results in misleading numbers due to impact from high-capacity office buildings.
In some ways, 2020 provides a better measure of consumer internet experience in New York City than measurements from previous years, due to the reduction in impact of business centers. Businesses often have high-bandwidth enterprise connections and dedicated lines that can result in higher results for a geographic area, regardless of the experience of residential customers on the same block.
This article was a followup to Jameson’s 2017 article on which neighborhoods in Brooklyn have the fastest broadband internet.