After-Hours Tour of the Fraunces Tavern Museum: "Path to Liberty"
Explore a new exhibit inside the oldest building in Manhattan, a witness to history throughout the Revolutionary War Era!


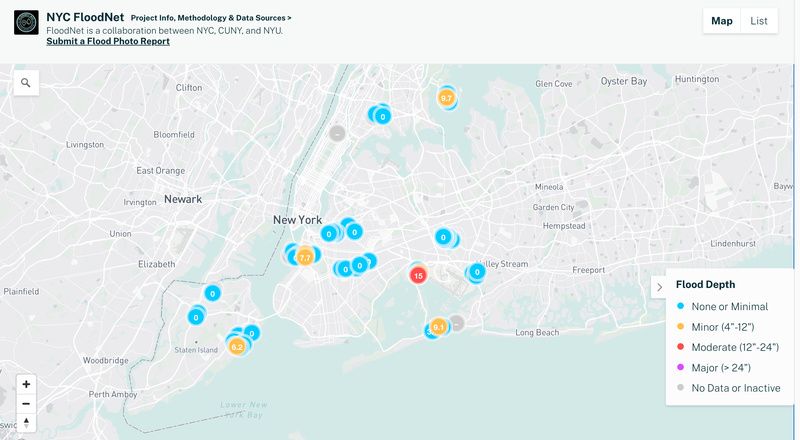
Friday’s torrential rains caused intense flash flooding on the streets of New York City and prompted Governor Hochul to declare a state of emergency. As the rain begins to subside in the city, subway service is severely restricted, many Metro-North trains are suspended, and roads remain treacherous. Throughout the boroughs, a series of hi-tech sensors are tracking the flood levels in real-time on a hyperlocal level.
Thinking how some neighborhood names give indication as to your flooding risk. I live in Crown HEIGHTS so my streets are fine. At my kid’s school in Park SLOPE cars are barely making it through… pic.twitter.com/vnyuEEJhLu
— Michelle Young (@michelleyoungNY) September 29, 2023
Run by FloodNet, a “cooperative of communities, researchers, and New York City government agencies,” these sensors provide residents with real-time flooding information. The goal of the FloodNet Project is to better understand and prepare for flooding in New York City. Data collected by the sensors is shared on this interactive map, which updates live. The map shows the location of each sensor and the current flood depth at that location. At a quick glance, you can see how severe the flooding is by the color-coded key which ranges from “none” and “minor” to “major,” which is more than two feet. On Friday morning, parts of Brooklyn and Queens saw depths well over a foot.

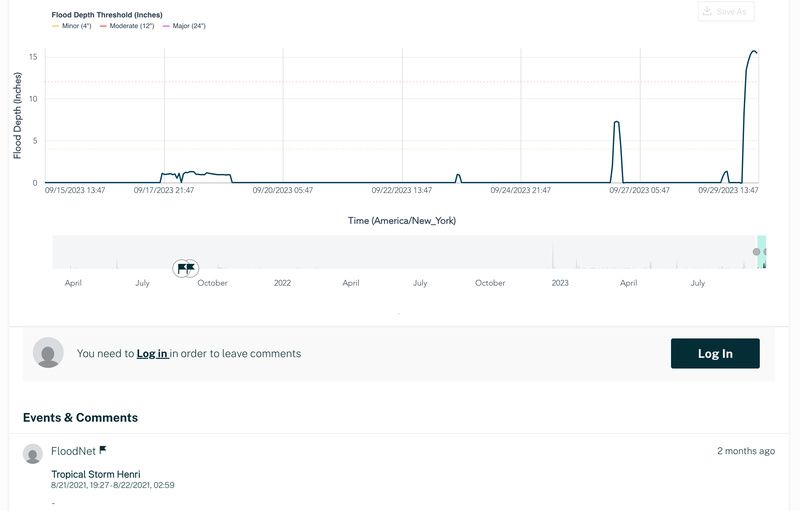
When you click on a sensor dot, more data becomes available. You can see a photo of the area where the sensor is installed along with a chart that shows recent flood depth measurements. Scrolling down, information on past flooding events is revealed.
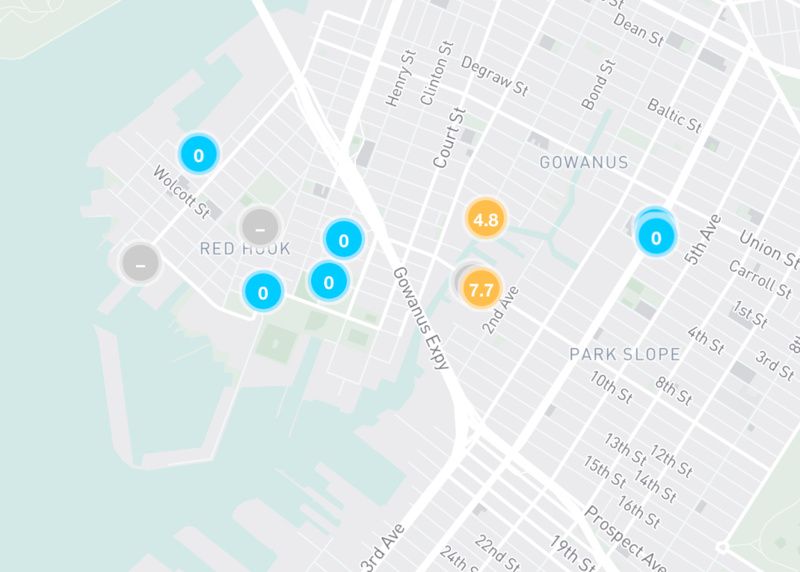
According to FloodNet’s Project Manager Polly Pierone, the locations where sensors are installed are determined “based on a combination of city input, community outreach, and an internal neighborhood prioritization process that incorporates NYC stormwater and tidal flooding maps, as well as a variety of other flood risk metrics.” Sensors were first installed in areas traditionally susceptible to tidal-influenced flooding such as Gowanus, Brooklyn, and neighborhoods surrounding Jamaica Bay. After receiving $7.2 million in funding from the city in early 2023, the program expanded. There are now sensors in coastal areas of Staten Island like Midland Beach, in parts of the Bronx like City Island, and in neighborhoods further inland in Queens and Brooklyn. There are more than 70 sensors active now, with plans to install up to 500 over the next five years.

Sensors run on solar power and use ultrasonic technology to measure flood depths. With permission from the Department of Transportation, sensors are affixed to on-street infrastructure such as parking signs and select utility, and light poles. An ultrasonic wave is sent out of the sensor to the surface below. The distance from the sensor to the surface below is calculated based on how long it takes that wave to bounce off and return to the sensor. The distance gets smaller and smaller as the flood levels rise. A pulse is sent out every minute and the data collected is sent wirelessly to collection gateways, then uploaded into the project’s data analysis and quality control pipeline. The sensors were developed by the FloodSense project at NYU and the CUNY Advanced Science Research Center (ASRC).
Before being deployed on the streets, the sensors were rigorously tested. The first experiment tested sensor accuracy in measuring the tidal flux of bodies of water such as the Gowanus Canal and Jamaica Bay. Data collected by the sensors was compared to tide gauges operated by the National Oceanographic and Atmospheric Administration (NOAA). Measurements from the FloodNet sensors taken during urban flooding events were also compared to manual measurements for accuracy. Once these experiments proved successful, the sensors were deployed to various New York City neighborhoods and their data was made public.

The FloodNet map is helpful as a storm is happening, but the data collected will also have a lasting impact beyond real-time reports. By creating a historical database of information on the presence, depth, and frequency of street flooding, the FloodNet project will help to examine the compound effects of extreme rainfall, higher seas, and higher water tables. Data is a powerful tool that the city can use to help inform decisions on infrastructure projects, safety preparations, and other initiatives that will help the city become resilient in the face of climate change and extreme weather events.
Residents are encouraged to get involved by submitting sensor suggestions via FloodNet’s survey here, and by submitting flood photos to their partners at Flood Watch, here.
Next, check out How NYC Responds to Snowstorms
Subscribe to our newsletter