NYC’s Forgotten ‘War on Christmas Trees’
Discover how an obscure holiday crackdown affects festive street vendors today!


If you love maps, there’s a good chance that the company CartoDB may have powered many of the ones you’ve seen. On Untapped Cities alone, CartoDB has been attributed to maps like the oldest place to drink by neighborhood, how connected neighborhoods will be to the LinkNYC Wifi portals, a map of doors photographed by a 1970s photographer, and many more. When CartoDB contacted us about their 2015 311 complaints dashboard, we were particularly interested because of our own NYC Big Apps finalist project last year on improving the 311 system. Did you know that 18 million calls go into 311 each year? That’s 50,000 per day.
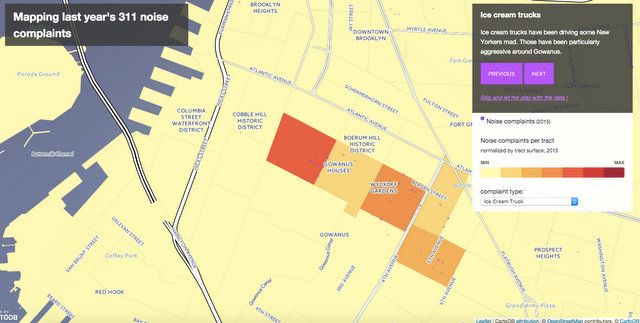
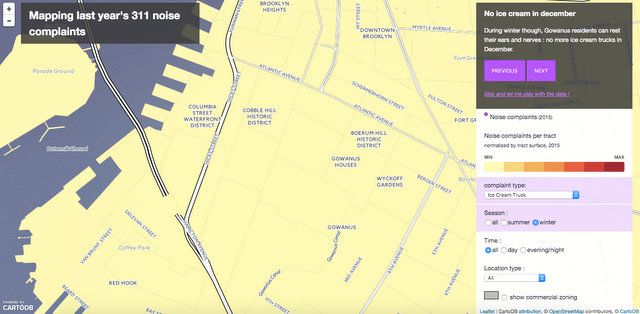
The CartoDB team was particularly interested in noise complaints, because as they say, it is a category that “cannot be realistically measured everywhere with sensors.” Thus, noise is measured subjectively and in New York City, may be the only widely available data source. More than just location, the 311 data also lets you know the type of complaint. For example, music complaints are common in Harlem and Inwood, though we personally love the vibrancy of street life in these neighborhoods. Ice cream trucks are a particular offender, and particularly in Gowanus (!). Comparison metrics include time of day, neighborhood, season, construction permits, and others.
Their interactive dashboard goes through some fun findings about 311 noise complaints:
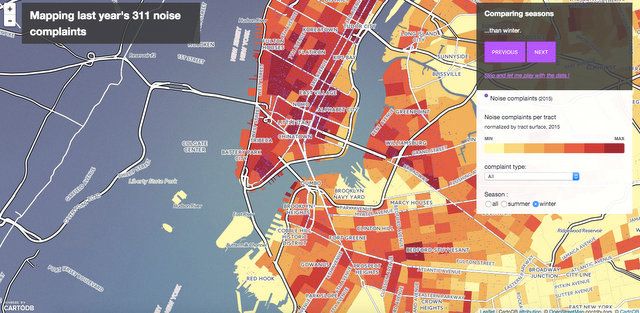
Winter complaints
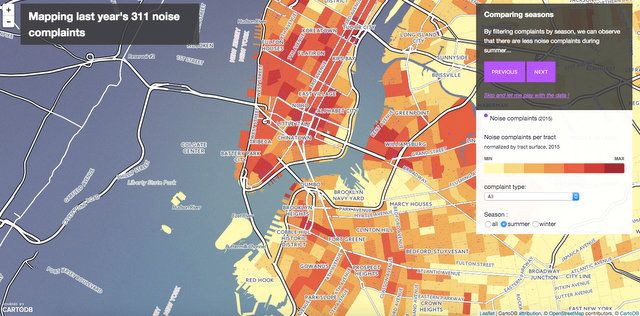
Summer complaints
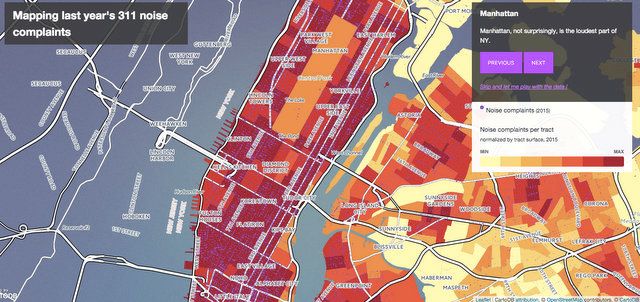
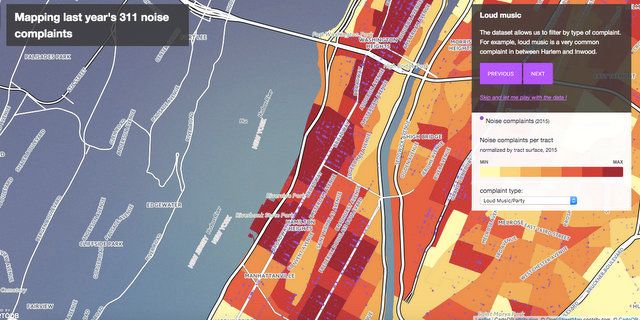
Some additional findings by the CartoDB team:
Next, check out our archives of Fun Maps.
Subscribe to our newsletter