NYC’s Forgotten ‘War on Christmas Trees’
Discover how an obscure holiday crackdown affects festive street vendors today!


[This post has been updated with new data for 2021: How COVID-19 Impacted Internet Speed in NYC by Neighborhood]
Ah, Brooklyn. The metropolitan culture of New York City paired with the Internet connectivity of a rural area. At least, that’s how it can feel when you move here from a less crowded city. Out in the underserved blocks of Bushwick and Williamsburg, the tantalizing promise of fiber feels more like a carrot on a stick than an infrastructure plan. (Only 62% have home fiber access, as of this writing). And it’s no surprise — census block maps of overlapping Internet coverage in the area confirm that most residents only have access to three or four providers. Factor in shady landlords and wiring issues, and it looks more like one or two “options.” Close-ups of this data map show that Internet infrastructure varies from block to block. If you’ve ever been in the position of sitting around waiting for FiOS while your neighbors have had it for years, you know how frustrating this disparity can be:
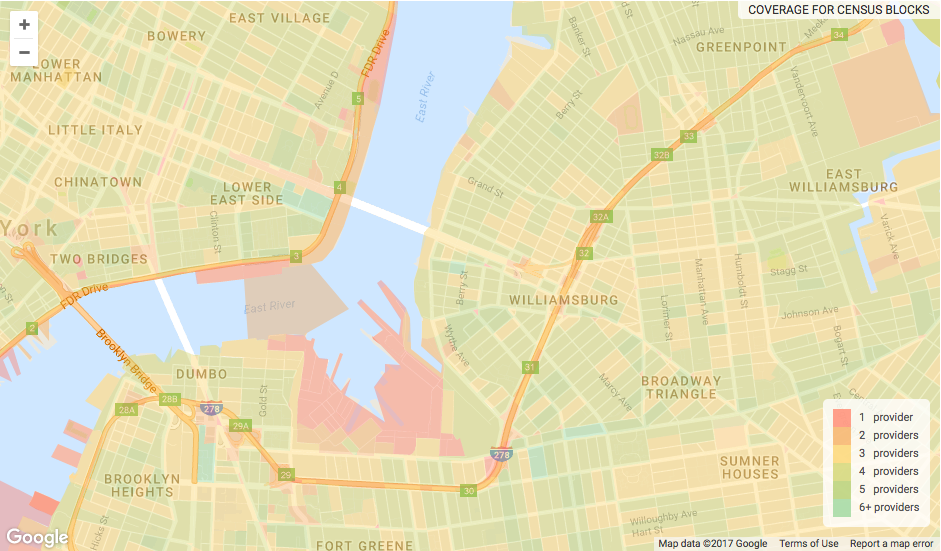
This data shows that farther-flung lower-income neighborhoods like Bushwick are typically given fewer options for Internet. This is presumably since it’s in a company’s interest to concentrate on more affluent areas, where customers are more likely to consistently pay higher monthly prices. Still, we wanted to know — coverage and availability aside, what Internet speeds do our neighbors actually get? Surprisingly, information about speed and availability in Brooklyn neighborhood is hard to come by. After all, it’s in the company’s’ interest to keep people in the dark about how advertised speeds compare to actual performance. So, we decided to dig into the speed test data from the Brooklyn area and get some answers. Rather than showing the “promised” speeds from Internet providers, these results show the real-world performance people actually get in 2017. Unsurprisingly, a lot of the neighborhoods that performed well were also neighborhoods that have large and active tech scenes, or serve as popular home bases for those populations. While it’s impossible to draw sweeping conclusions from speed test data, fluctuations in speed varying from 100 Mbps all the way up to the gigabit range suggest that some neighborhoods have wide access to fiber, while others do not. (Incidentally, FiOS is currently fighting a lawsuit with the city for allegedly failing to honor their side of a universal coverage agreement.) Here are the 10 fastest internet speeds in Brooklyn by neighborhood.
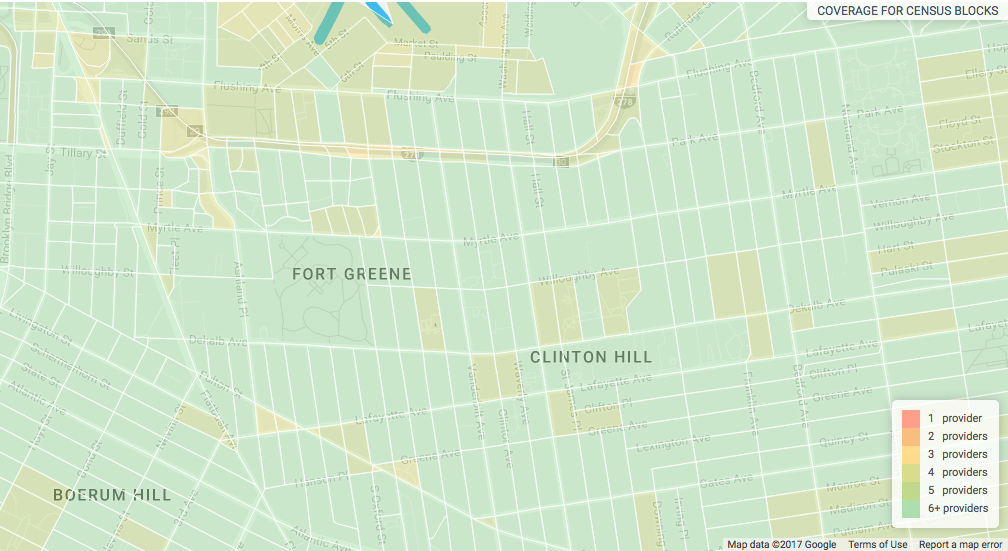
Density of Internet Provider competition in Fort Greene and Clinton Hill
90th Percentile Average speed: 215.36 Mbps Fastest Recorded Speed: 800.63 Mbps Tech Presence: Fort Greene’s roost at the top of this list is no surprise, given the unusual density of startups and tech companies in the area. According to a map from Digital NYC, Fort Greene has more tech startups than most other Brooklyn neighborhoods put together. Only Dumbo beats them out in terms of number of tech offices, although we were surprised to see Dumbo’s zip code down at #5 when it comes to download speed performance. Co-Working Spaces:
Internet Providers:
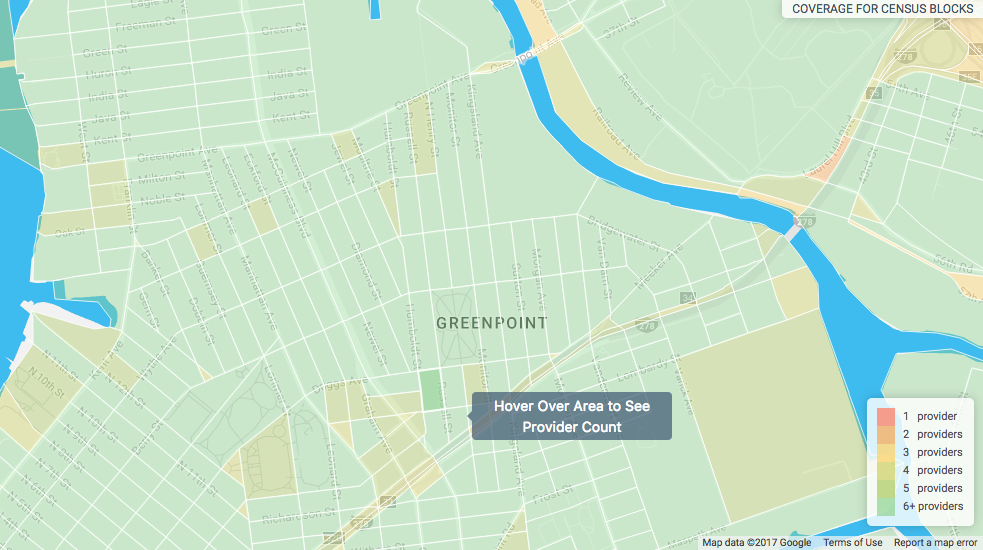 Density of Internet provider competition in Greenpoint
90th Percentile Average speed: 211.6 Mbps Fastest Recorded Speed: 544.84 Mbps Tech Presence: Kickstarter and Urban-X are the biggest names in Greenpoint, but the laid-back vibe and somewhat cheaper (relative to Manhattan) cost of living has brought a thriving tech community here. Even if the biggest tech offices aren’t based here, much of the young creative class that drives them calls Greenpoint home. Co-Working Spaces:
Internet Providers:
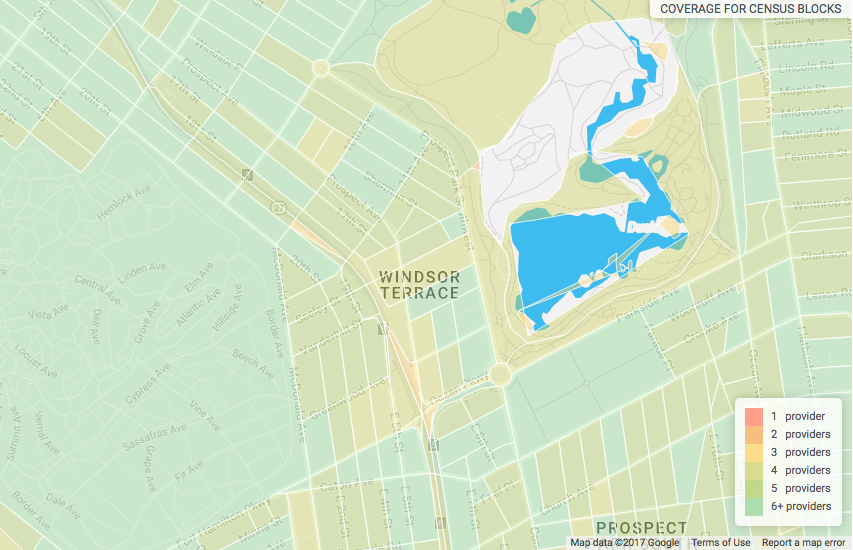 Density of Internet Service competition in Windsor Terrace.
90th Percentile Average speed: 207.14 Mbps Fastest Recorded Speed: 803.18 Mbps Tech Presence: This neighborhood isn’t known for the tech scene, but the unusually high speed test results are likely a sign of wide access to Fios and a high density of wealthy residents able to afford faster service. Internet Providers:
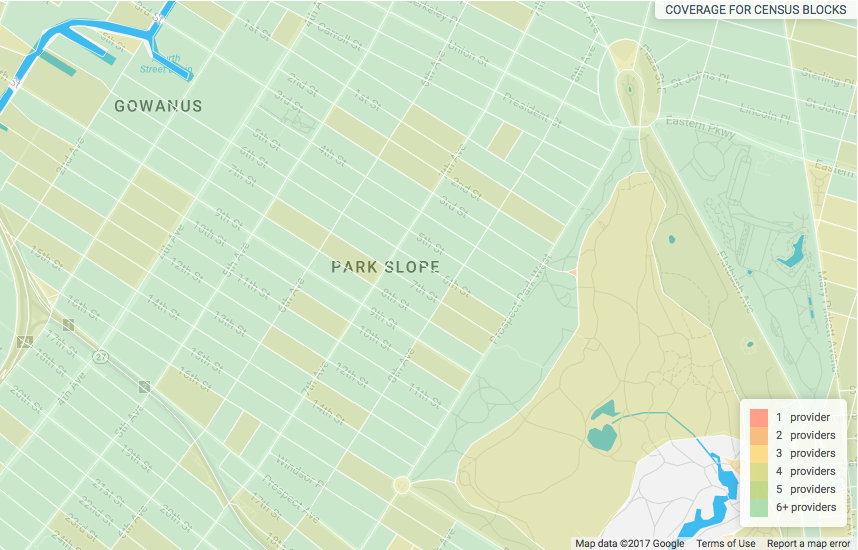 Density of Internet Service competition in Park Slope.
90th Percentile Average speed: 206.86 Mbps Fastest Recorded Speed: 803.18 Mbps Tech Presence: Park Slope also has a subdued tech presence, although much like Greenpoint it’s a popular place for young professionals working at local startups to live. It’s a popular pick for young professionals and new parents who commute into the city or Dumbo. Internet Providers:

Density of Internet Service competition in Dumbo and surrounding areas.
90th Percentile Average speed: 205.47 Mbps Fastest Recorded Speed: 591.46 Mbps Tech Presence: Dumbo is the undisputed beating heart of Brooklyn’s tech scene, featuring agencies like HUGE and successful startups like Etsy. Neighboring blocks in the same zip code share in the benefits. The big draw here during the original tech boom was access to cheap warehouse spaces in quick proximity to Manhattan. The exposed-brick open-office aesthetic is no less trendy in 2017, and Dumbo is crammed with them. The density of high-performance business connections is likely the driving force behind the high download speed readings in this area. Co-Working Spaces:
Internet Providers:
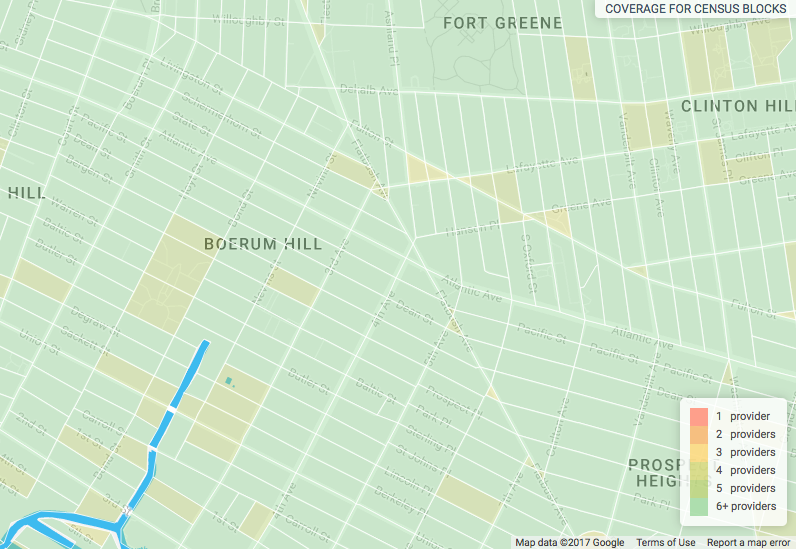
Density of Internet Service competition in Boerum Hill, Brooklyn.
90th Percentile Average Speed: 205.23 Mbps Fastest Recorded Speed: 591.46 Mbps Tech Presence: This enclave is mostly known for expensive brownstones and proximity to Manhattan, and the speed test readings suggest that residents here are willing to pay well for strong residential connections. For those who can’t afford the brownstones, Boerum Hill is home to one of the “Common” co-living startup spaces. (Think luxury dorms for adult tech workers.) Internet Providers:
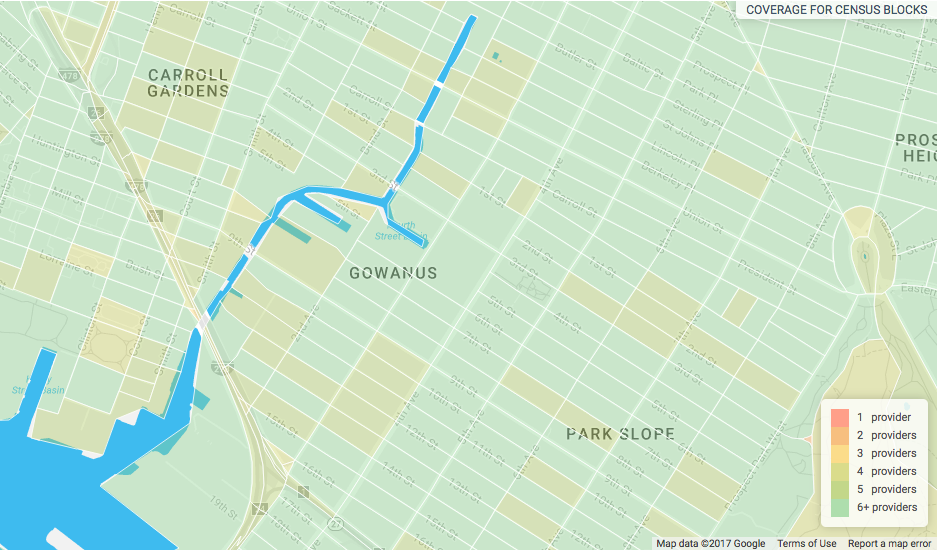
Density of Internet Service in Gowanus, Brooklyn
90th Percentile Average speed: 205.05 Mbps Fastest Recorded Speed: 478.51 Mbps Tech Presence: Gowanus is home to a handful of smaller startups, including Gimlet Media, who virtually every techie in America has encountered thanks to their well-liked podcast “Startup.” (Worth a listen for anyone with entrepreneurial tendencies. Their feature on American Apparel is particularly interesting.) Internet Providers:
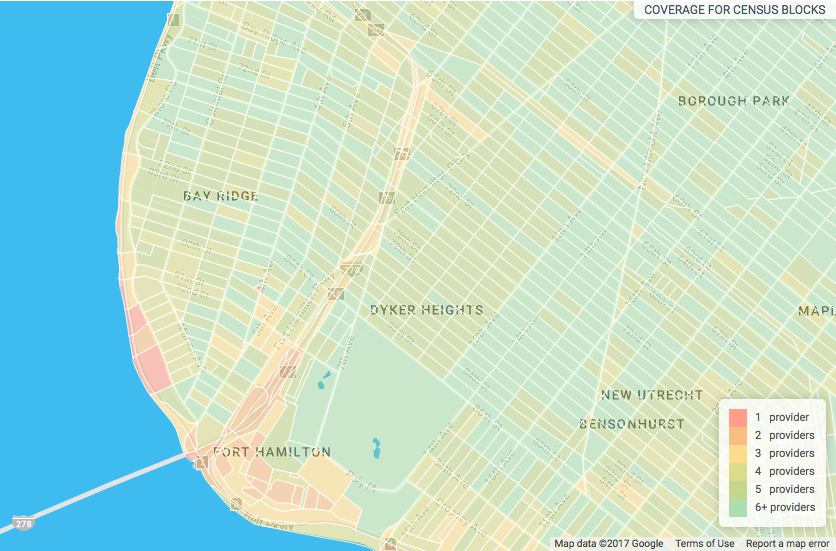
Density of Internet Service competition in Bay Ridge and Fort Hamilton
90th Percentile Average speed: 176.67 Mbps Fastest Recorded Speed: 437.28 Mbps Tech Presence: The Bay Ridge area is something of a dead zone when it comes to tech and startups. But the residents apparently value fast connections, and are willing to pay for them. Internet Providers:
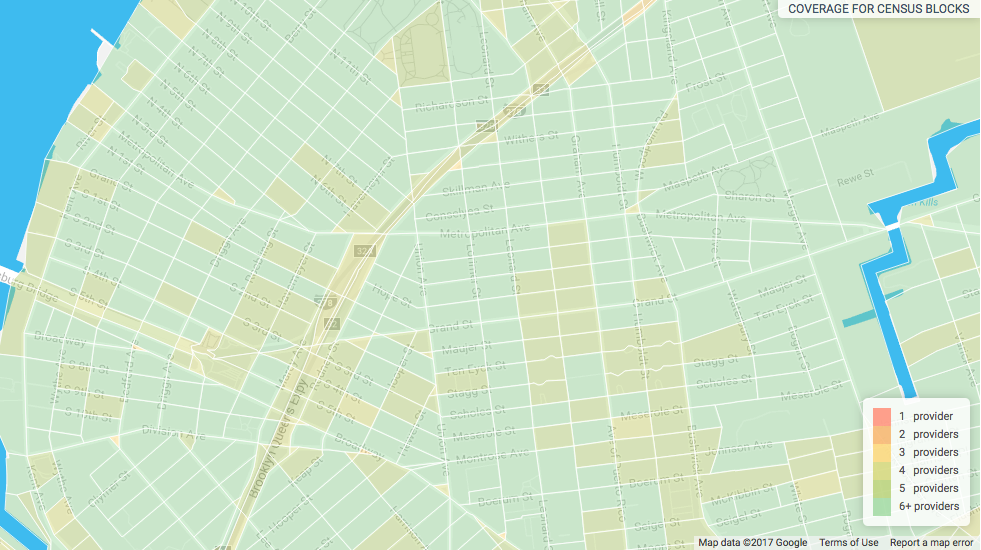
Density of Internet provider competition in Williamsburg, Brooklyn.
90th Percentile Average speed: 155.05 Fastest Recorded Speed: Mbps Tech Presence: Williamsburg was one of Brooklyn’s original targets for gentrification, and home to tech and media giants like Vice that skew young. Other names in the area are less recognizable, but no less successful. Livestream is based in the area, as well as Hater, the dating app that connects people based on mutual dislikes. Co-Working Spaces:
Internet Providers:
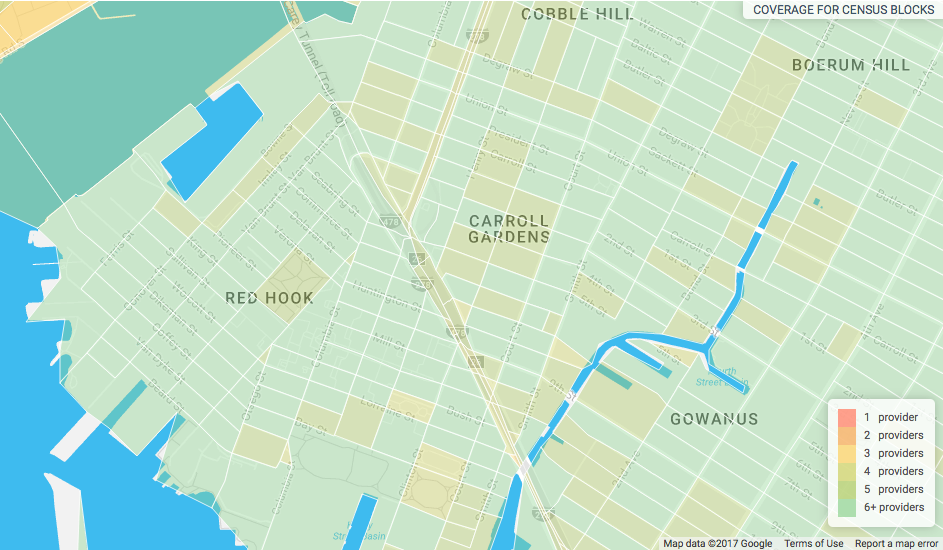
Density of broadband provider competition in Carrol Gardens and Red Hook
90th Percentile Average speed: 150.14 Mbps Fastest Recorded Speed: 531.37 Mbps Tech Presence: The Red Hook area was traditionally more blue-collar industrial than blue-flip-flops tech sector, but that’s changing as some larger office spaces in Dumbo throw in the towel on rising rents and embrace a cheaper, more down-to-earth neighborhood. Innovation Studios, Stink Studios, and other creative groups and agencies have already moved shop to enjoy the waterfront. Co-Working Spaces:
Internet Providers:
Want to know how the rest of the Brooklyn neighborhoods fared? See the following chart from Brighton Beach to Bedford-Stuyvesant:
| Neighbourhood | 90th Percentile average | Max speed recorded |
|---|---|---|
| Bedford-Stuyvesant | 149.36 | 800.63 |
| Prospect Heights | 147.95 | 663.84 |
| Dyker Heights | 146.93 | 486.71 |
| Canarsie | 137.09 | 308.41 |
| Jamaica Bay | 137.09 | 308.41 |
| Flatlands | 118.97 | 418.61 |
| Kings Plaza | 118.97 | 418.61 |
| Marine Park | 118.97 | 418.61 |
| Mill Basin | 118.97 | 418.61 |
| Parkville | 109.64 | 413.31 |
| Bensonhurst | 109.51 | 413.31 |
| Bath Beach | 109.26 | 391.67 |
| East New York | 108.2 | 291.28 |
| Gravesend | 106.73 | 420.48 |
| Stuyvesant Heights | 106.36 | 191.13 |
| Homecrest | 100.89 | 483.22 |
| Kensington | 100.81 | 641.19 |
| Brooklyn College | 100.5 | 427.84 |
| Vanderveer | 100.5 | 427.84 |
| Cypress Hills | 99.73 | 589.73 |
| Ditmas Park | 98.08 | 641.19 |
| Kings Highway | 96.37 | 483.22 |
| Madison | 96.37 | 483.22 |
| Brower Park | 94.53 | 311.62 |
| Weeksville | 94.53 | 311.62 |
| Brighton Beach | 94.05 | 315.53 |
| Manhattan Beach | 94.05 | 315.53 |
| Sheepshead Bay | 94.05 | 315.53 |
| Sunset Park | 93.81 | 430 |
| Bushwick | 91.02 | 606.97 |
| Midwood | 90.51 | 492.47 |
| Borough Park | 89.96 | 446.4 |
| Crown Heights | 85.87 | 311.62 |
| Coney Island | 85.3 | 304.02 |
| Sea Gate | 85.3 | 304.02 |
| Brownsville | 84.54 | 204.78 |
| East Flatbush | 84.1 | 543.58 |
| Greenwood | 80.96 | 380.01 |
| Industry City/Bush Terminal | 80.96 | 380.01 |
| Flatbush | 74.3 | 501.84 |
| Prospect Lefferts Gardens | 65.58 | 260.7 |
| Prospect Park South | 59.39 | 501.84 |
| Starrett City | 54.27 | 175.8 |
A quick note about this data: speed test results are sourced from M-Labs, known for partnering with Google’s search default speed test tool. Their results are widely regarded as the most accurate and least biased publicly available. Since M-Labs speed tests are categorized by zip codes, we’ve grouped some neighborhoods that share zip codes together, and combined zip codes to form approximate boundaries for others. While not exact, this method gives a reasonably accurate idea of speeds in each neighborhood. The results shown here were pulled from dates between May 2016–April 2017. Most zip codes had between 1,000–4,000 recorded tests in that time range.
What the situation with Verizon FiOS and other incumbent Internet providers in Brooklyn has been a major frustration for longtime residents, the future for the city does actually look favorable — even with mergers of major companies in mind. Brooklyn’s Kings County is the only county in the state with 100% access to 25 Mbps “true broadband” as defined by the FCC: Keep in mind that this is a bit misleading, however, since some of that “access” costs hundreds of dollars per month — more than residents in less lucky neighborhoods can likely afford. Those left in the dark are stuck with slow, capped solutions like mobile hotspots or tethered 3G plans. That said, the future of connectivity in Brooklyn is promising and has been improving. Technologies like 5G are right around the corner, which could potentially compete with wired Internet in some areas. Wireless companies like Starry are already experimenting with innovative ways to bring home internet to consumers in markets like Boston without relying on traditional cable networks, leapfrogging cable monopolies in urban environments. Meanwhile, Elon Musk is promising to release low-orbit satellite networks that solve the latency problems of traditional satellite internet as soon as 2019. For those of us willing to wait 5 years or so, it seems like Netflix binging will be just a little bit easier. Hopefully, it’ll also become a little bit cheaper.
Subscribe to our newsletter