Last-Minute NYC Holiday Gift Guide 🎁
We’ve created a holiday gift guide with presents for the intrepid New Yorker that should arrive just in time—


Graffiti is illegal in New York City and always has been. Wait–are you serious? Have you seen the East Village? Despite many areas of the city having thicker deposits than Boo the Dog‘s hair, authorities have been cracking down on graffiti since 2004.
In 2004 the Citywide Vandals Task Force was formed and NYPD began using the 311 telephone system to track and monitor all graffiti complaints on a daily basis. Myself and Charles-Antoine Perrault, of the Paris/NYC map mashup fame, decided to look for any patterns in the data. Here is a map of all 311 graffiti complaints and cleanup requests in Manhattan from April 2010 — April 2011:
In Manhattan, cleanup requests are most frequent in the East Village, Lower East Side, Washington Heights, and Inwood neighborhoods. Using this data, a choropleth map can be generated to show exactly which block groups have the most cleanup requests.
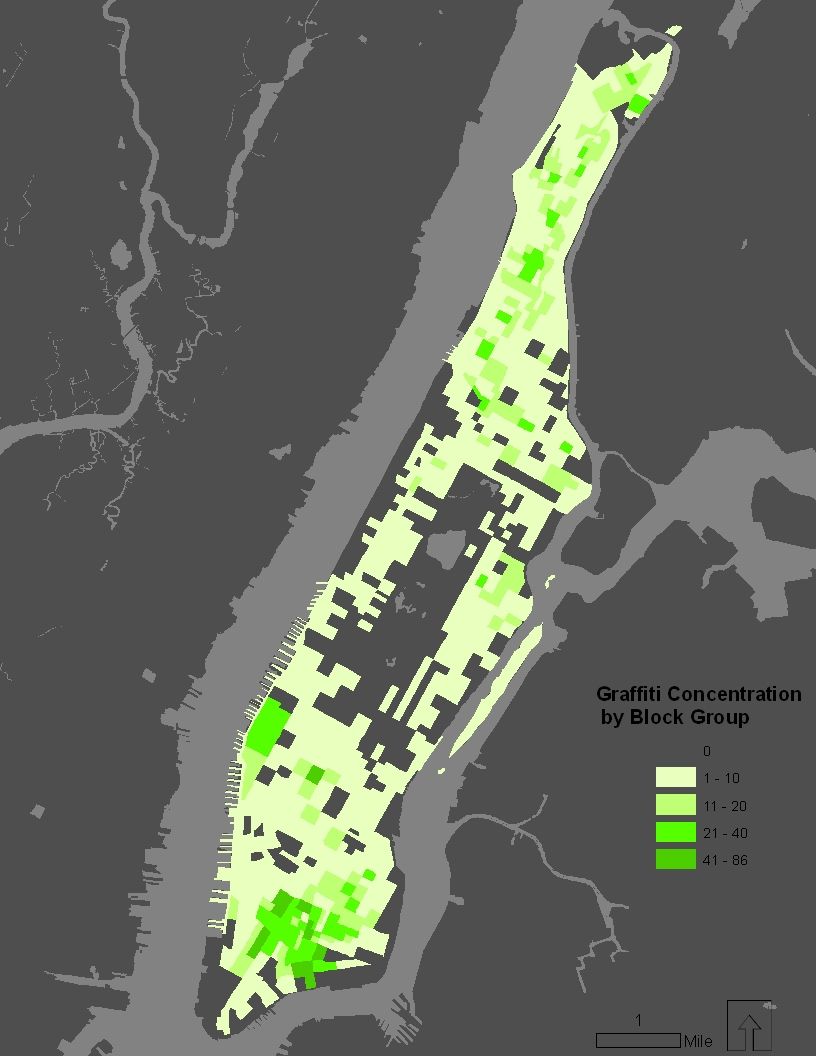 Graffiti concentration by block group (click to enlarge)
The darker shades of green represent more cleanup requests. 59 of the block groups had 20 or more cleanup requests over the one-year span. We thought it be interesting to learn about the characteristics of these specific neighborhoods and what they have in common, if anything, with their Manhattan neighbors?
The following three maps illustrate the median income, population age 25 and over with a Bachelors Degree, and average land value per square foot for the selected block groups (not all of Manhattan).
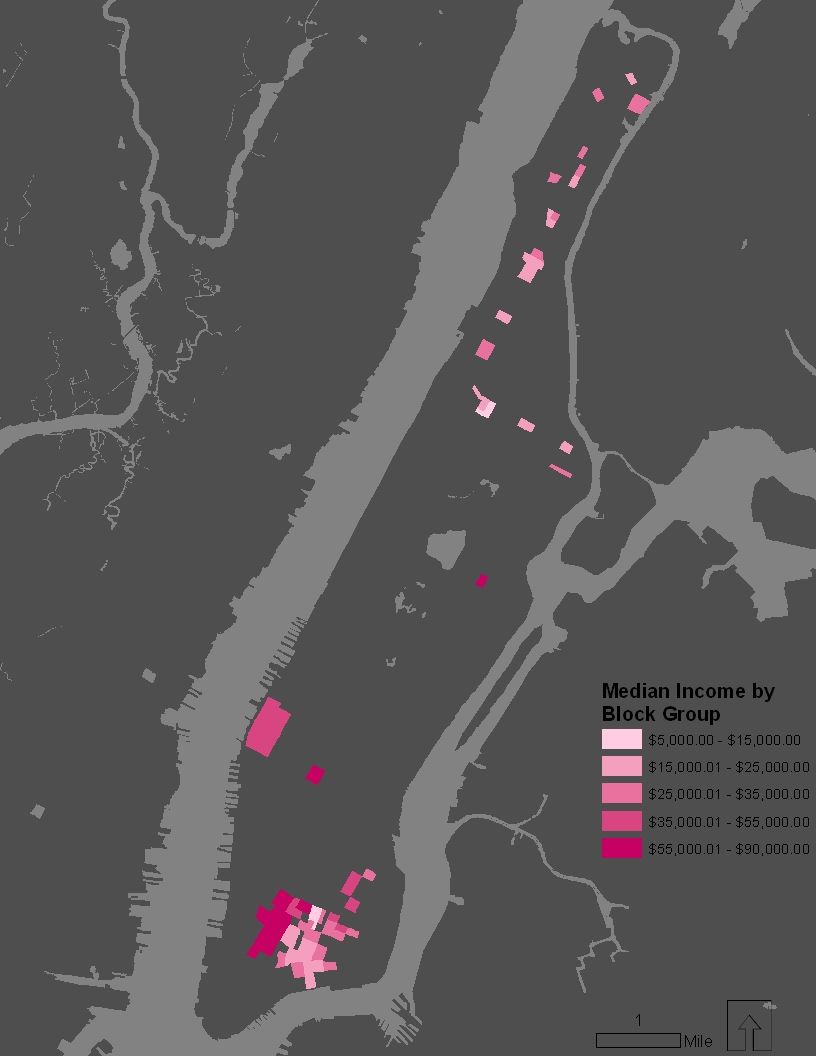 Median income by block group (click to enlarge)
Block groups with 20 or more requests have an average median income of $33,370, which is considerably lower than all of Manhattan ($50,437) and Manhattan block groups without any requests ($67,939).
The average percentage of population age 25 and over with a Bachelors Degree is considerably lower in areas of higher graffiti cleanup concentration. Only 1- 5% of the population aged 25 and over possesses a Bachelors Degree in 36% of block groups with 20 or more requests. The average percentage for block groups with 20 or more requests is 13%, whereas Manhattan is 25% and areas without a request are 22%:
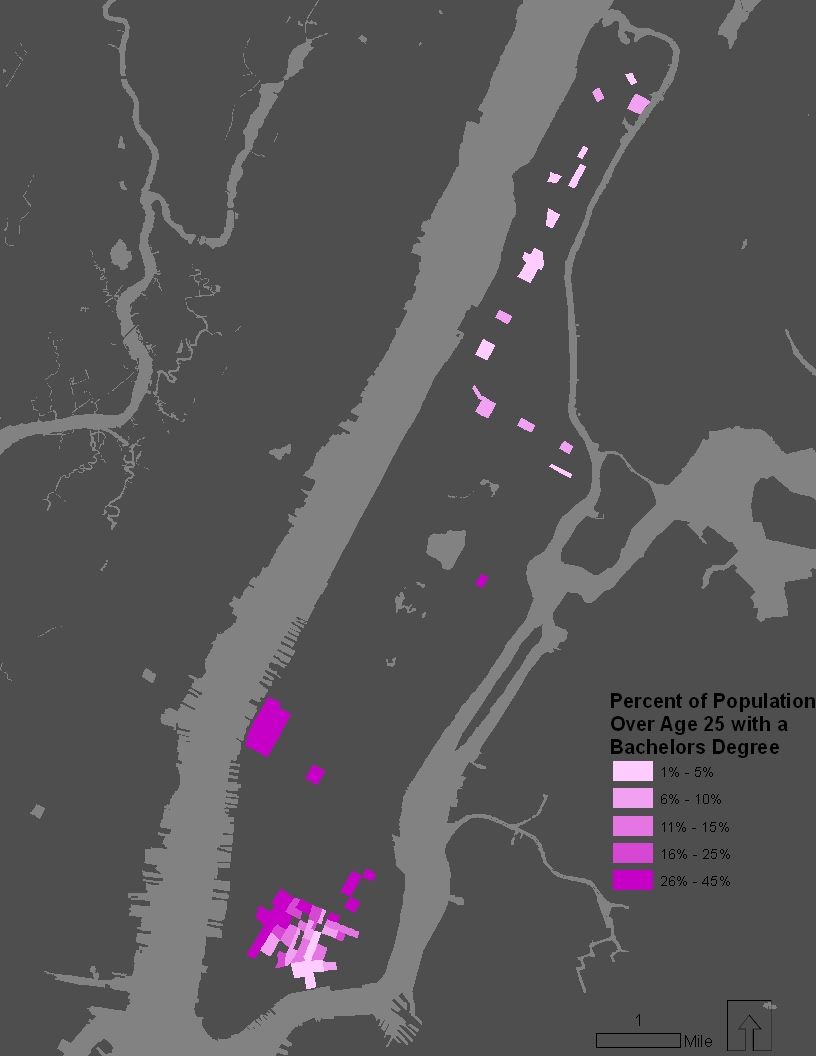 Percent of population over age 25 with Bachelors Degree (click to enlarge)
Areas with higher concentrations of graffiti cleanup requests have lower average land value per square foot. Block groups with 20 or more requests have only 10% of land valued greater than $90 per square foot, whereas 56% of land is valued greater than $90 per square foot in block groups without any requests. The average land value per square foot is $48 for block groups with 20 or more requests, $90 for all of Manhattan, and $165 for block groups without any requests:
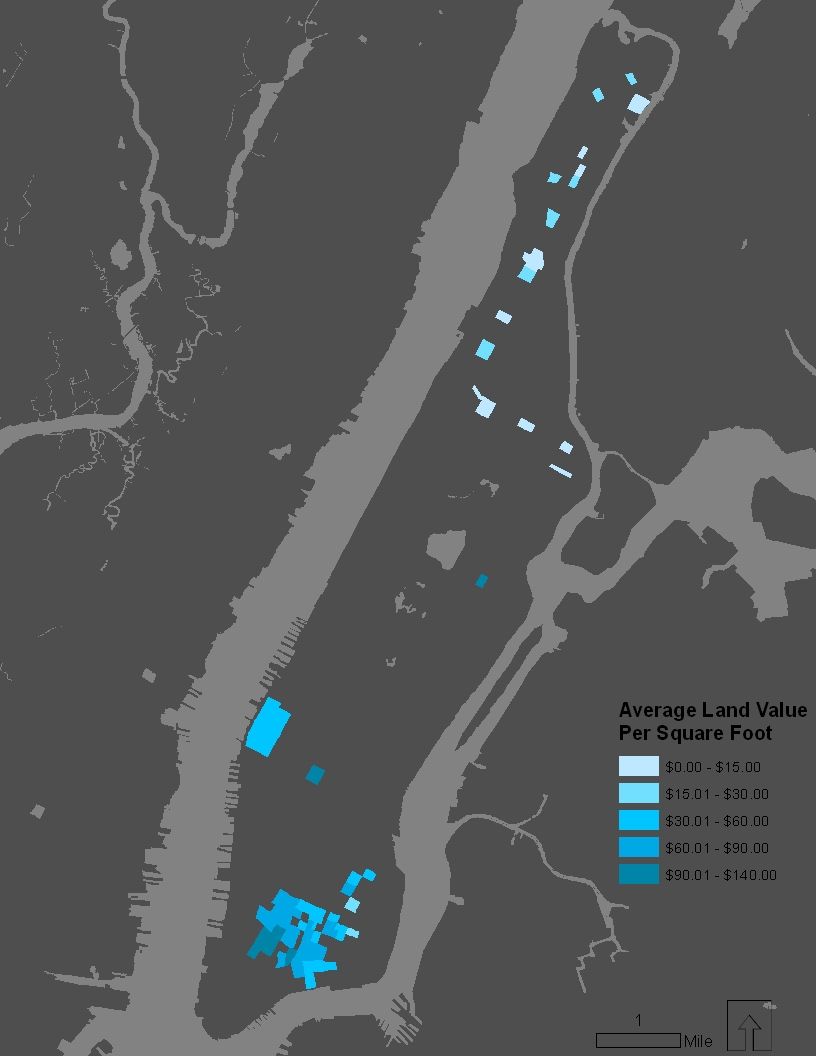 Average land value per square foot (click to enlarge)
Income, education, and land value are all significantly lower in areas that possess higher numbers of graffiti cleanup requests. What exactly does this mean? Spurious correlation or not, at the very least, the 311 data has uncovered some interesting trends between graffiti and neighborhood typologies. At the very least, this data has shown there are many areas of Manhattan where people enjoy talking to 311 operators.
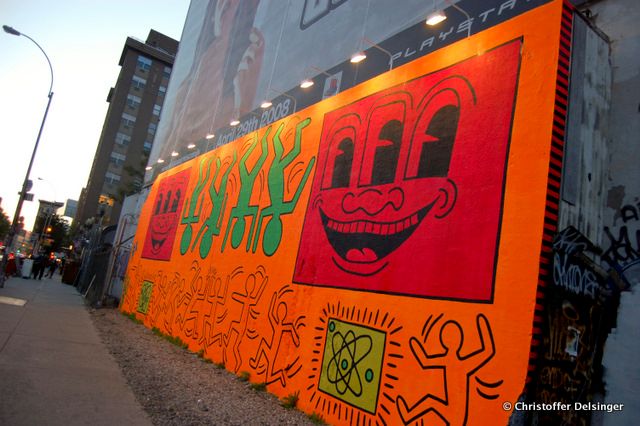
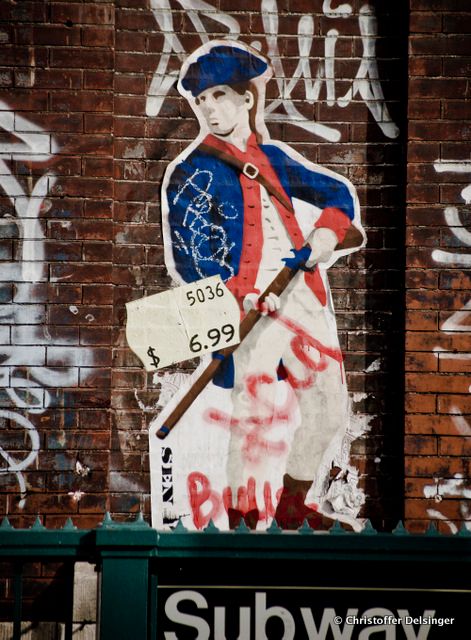
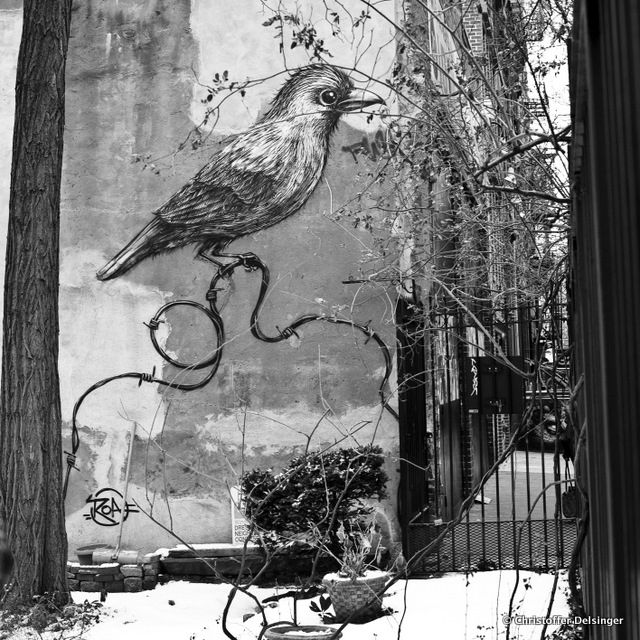
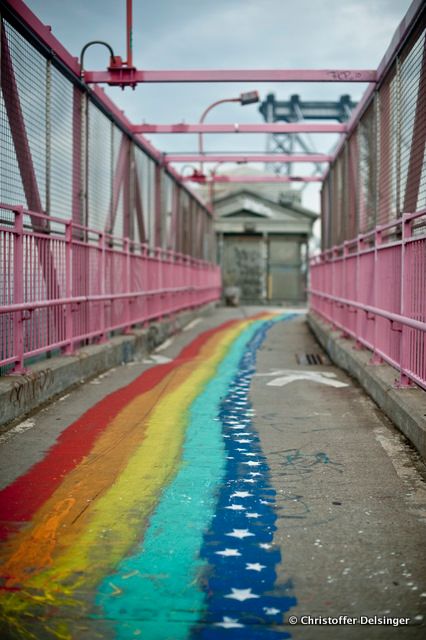
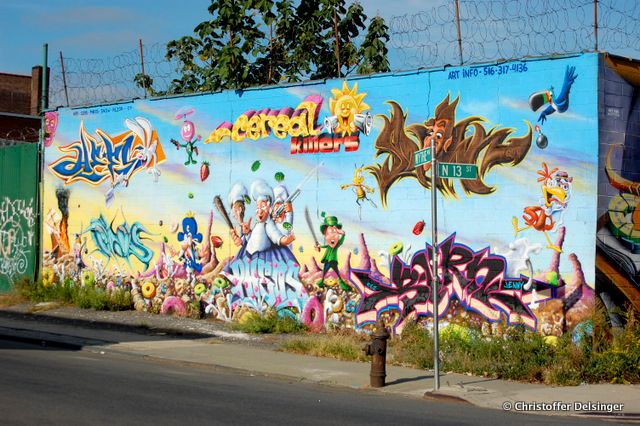
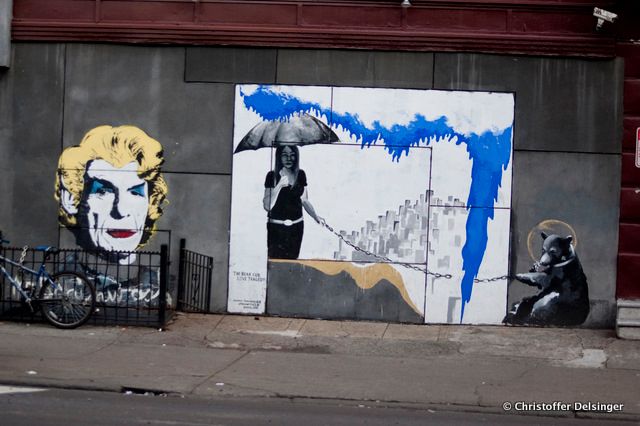
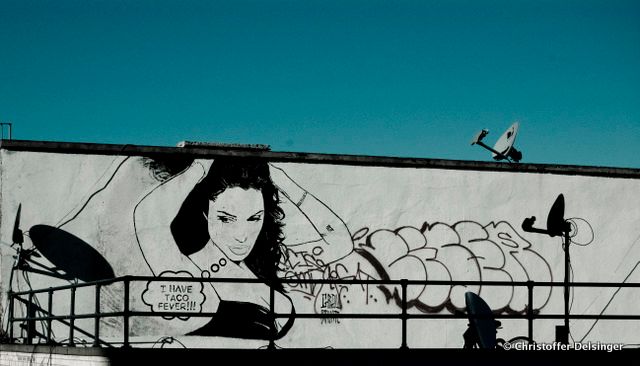
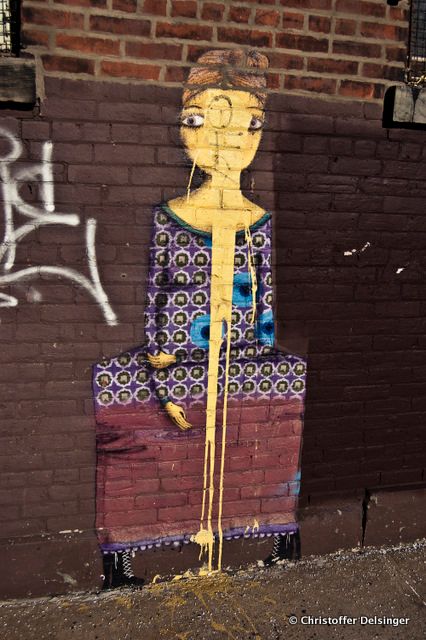
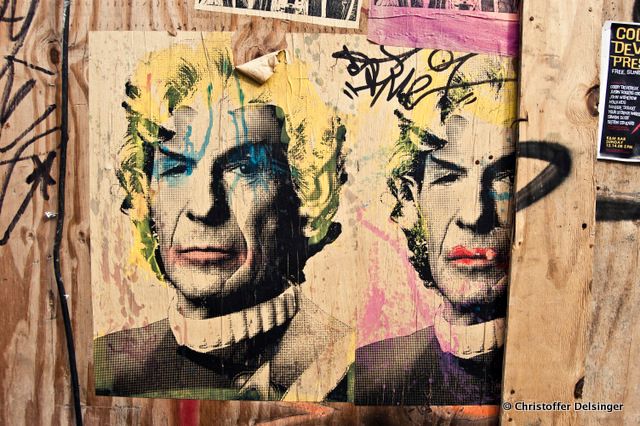
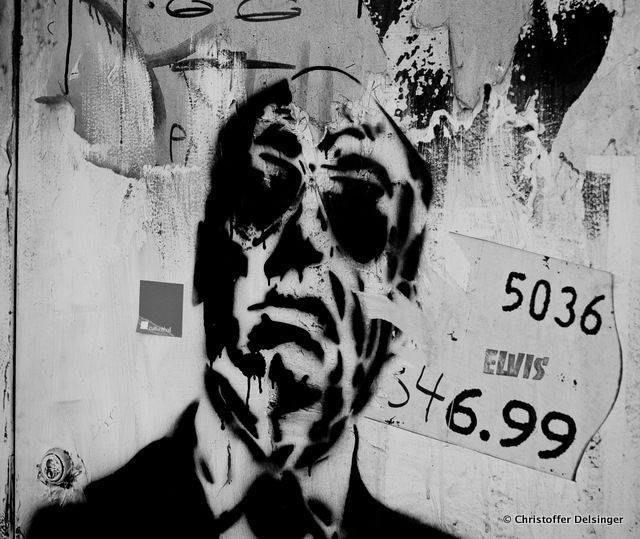
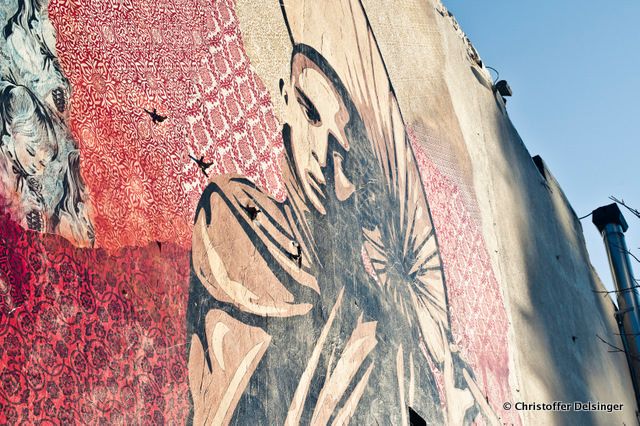
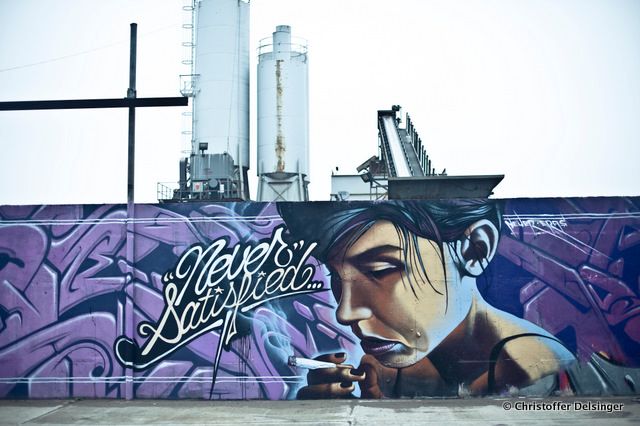
Here are some additional New York City graffiti shots by Untapped photographer Christoffer Delsinger. While these aren’t the typical tagging graffiti, we wanted to showcase some of the amazing, yet ephemeral, street art there is here in the city.
Michael Curley and Charles-Antoine Perrault are graduate students in the Columbia University Graduate School of Architecture, Planning and Preservation (GSAPP).
Subscribe to our newsletter