First off, who knew there was a census for trees? The tree census takes place every ten years, with the last census in 2005 and the next one occurring this year. Jill Hubley, a web developer from Brooklyn, has put together a beautiful interactive map of New York City’s tree distribution, based on the 2005 census. She also filed a FOIL (Freedom of Information Law) request for the 1995 tree census, and will have the results at the end of this month. This means she’ll be able to compare the tree cover evolution in New York City over time, accounting for the city’s Million Trees Initiative, and later add this year’s results.
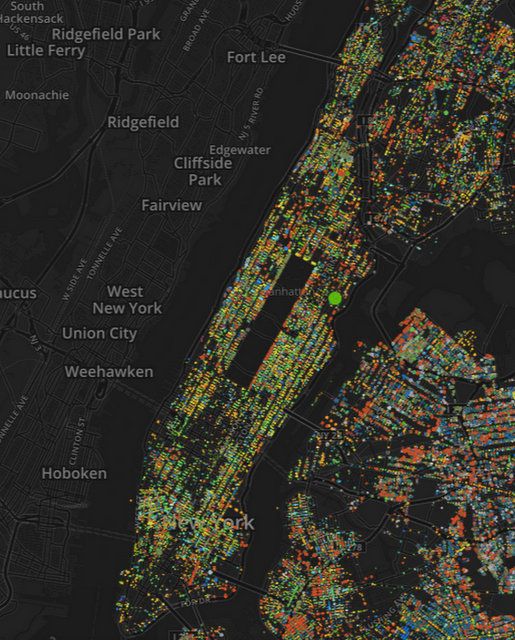
Manhattan
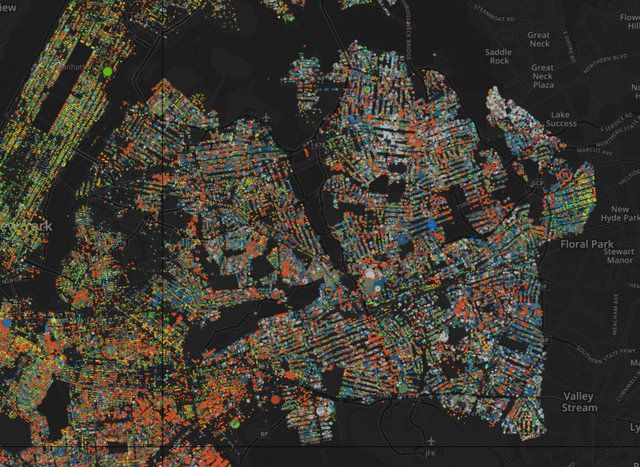
In the map, available on Hubley’s website (h/t Citylab), you can filter by species or zoom in to click on particular data points. Hubley writes that 25% of New York City’s tree canopy is provided by street trees, and according to Citylab, Queens is home to more than 40% and Brooklyn at 24% (though Manhattan has the densest concentration with 50 trees for every mile of sidewalk).
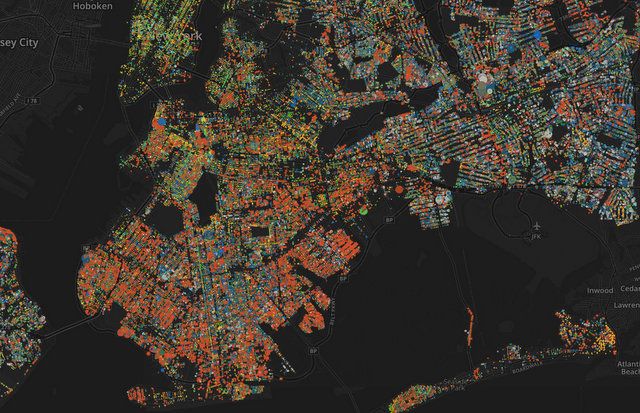
Brooklyn
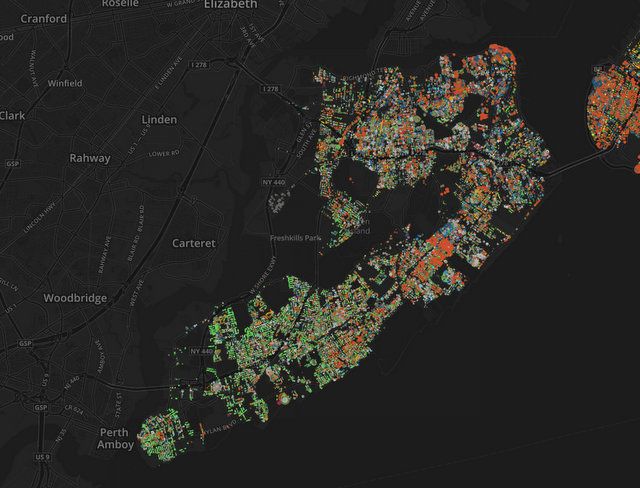
Staten Island
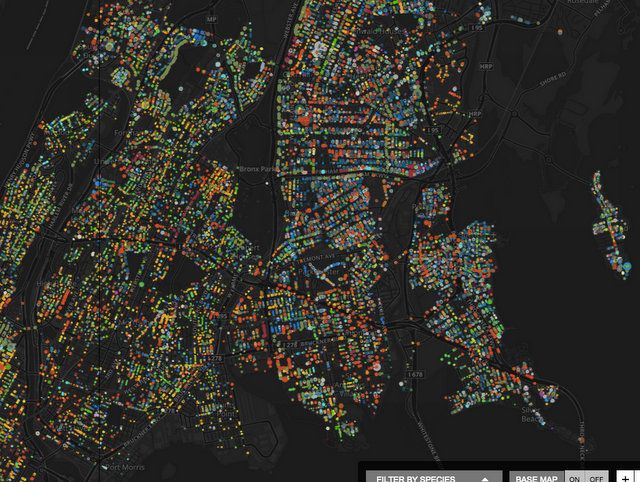
The majority of a particular type of tree also varies by borough, with London Plane dominating Brooklyn at 23.6%, Norway maples in Queens at 18.3%, Honey locusts in Manhattan at 23.3% and Calley pears in Staten Island at 24.8%. Bronx gets a more even distribution of the above trees.
The Bronx
Queens
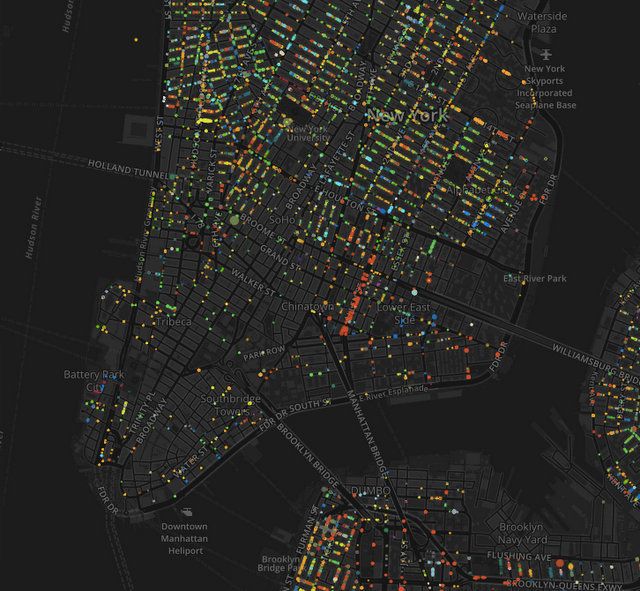
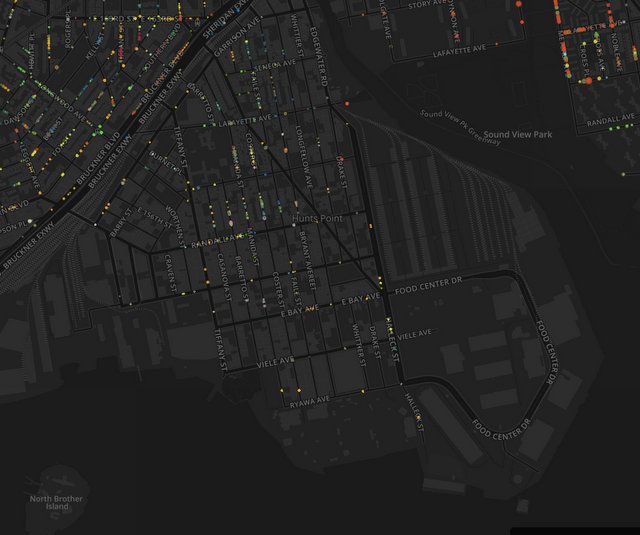
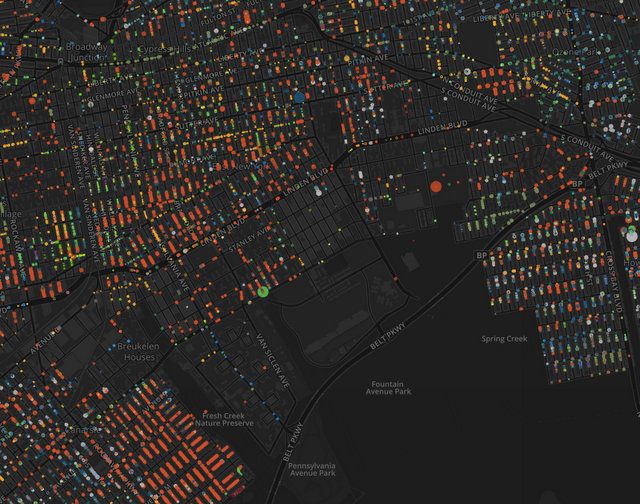
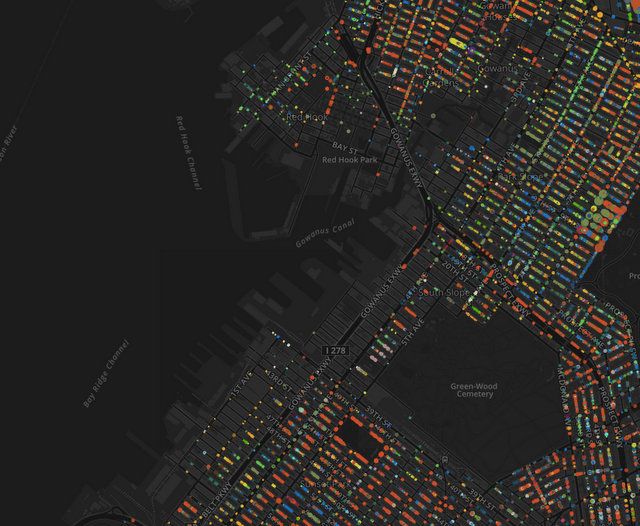
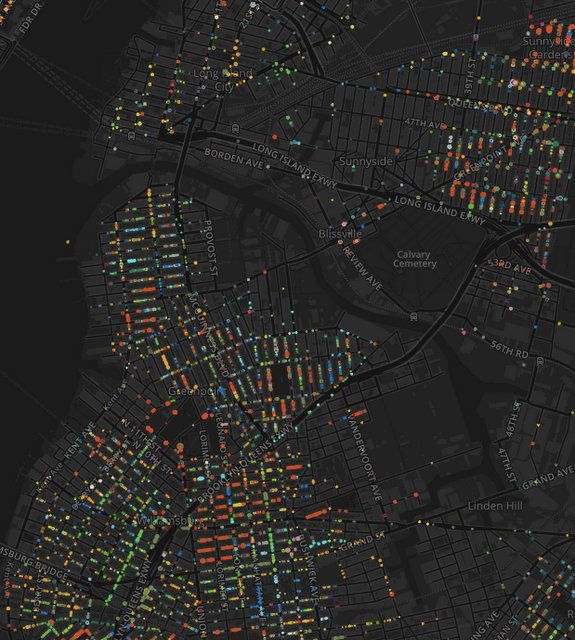
What we found interesting was to look at the swaths of areas that are underplanted in terms of street trees. Some areas aren’t surprising like the predominantly industrial areas of Newtown Creek environs, Sunset Park/Red Hook waterfront, and Hunts Point, or areas like Canarsie. But downtown Manhattan is also pretty sparse too.
Downtown Manhattan
Hunts Point
Canarsie
Red Hook/Sunset Park waterfront
Newtown Creek environs
The data comes from the city’s open data portal, and is used by the Parks Department “to define the habitat for each planting area, which in turn determines the range of species that can be planted,” according to Hubley.
Michelle is the founder of Untapped New York and the author of The Art Spy: The Extraordinary Untold Tale of WWII Resistance Hero Rose Valland, Secret Brooklyn, Secret New York, and Broadway. michelleyoungwriter.com