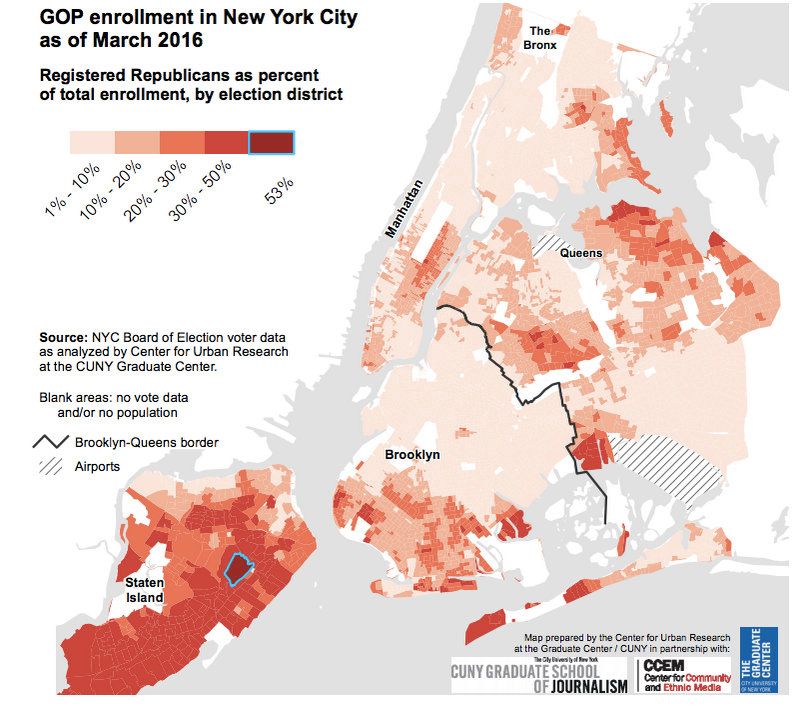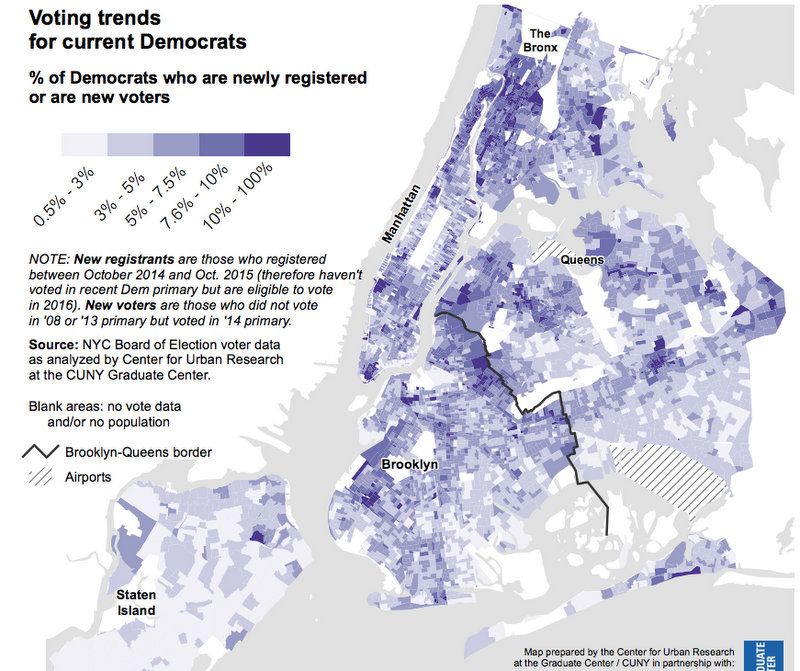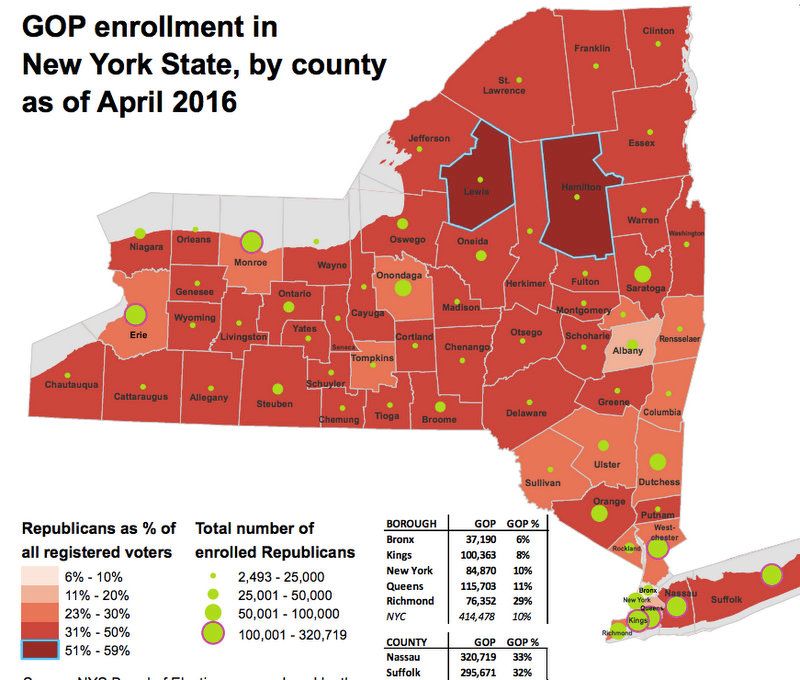

Next week is New York City’s Presidential Primary and the Center for Urban Research at the Graduate Center of the City University of New York has updated its NYC Election Atlas for the 2016 Primary. You can find maps by election district of Democratic and Republican enrollment, where Clinton supporters were located in 2008, voting trends for primary voters, new Democrats, and more. All of these maps have further drill-downs with overlays by ethnicity, income, occupation, household types and more.
Here are some fun facts from the 2016 Primary section of the NYC Election Atlas:
- 2.7 million of the city’s 3.9 million registered voters are enrolled as Democrats as of March 2016
- The lowest concentration of Democrats are in Staten Island, but the borough also has the second to lowest population of Republicans
- Queens has the largest number of Republican voters

Ever wondered why Republican candidates run active campaigns in New York City, despite smaller numbers of Republican voters? As explained by the Center for Urban Research: “Compared with the rest of the state, however, New York City — simply because of its density — has enough of a concentration of Republicans that the GOP presidential candidates have led highly visible campaigns here.”

Within the democrats there isn’t a clear pattern of voting historically Given this mixed picture for active primary voters, it’s not surprising that both candidates in 2016 are actively courting these [Democratic primary] voters.”


Update: See the unofficial map of Primary Results here. See more maps and get further detail at the NYC Election Atlas.
Next, check out NYC’s Presidential Haunts.


