


You know the results of last week’s primary election in New York state but the team at the Center for Urban Research at the Graduate Center of the City University of New York updated the database of maps on their NYC Election Atlas following the election, which we covered before the Primary. There’s even a map to show location of the “purged” voters in Brooklyn.
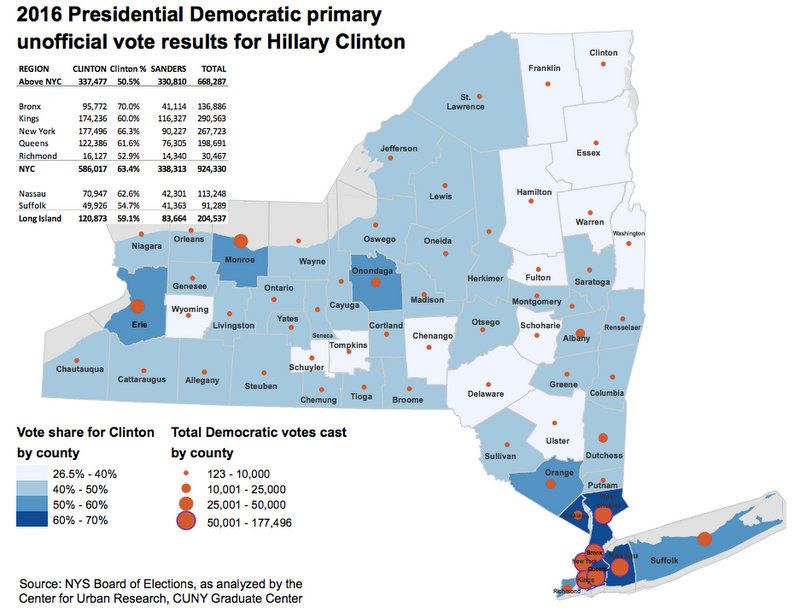
In New York City, Clinton performed even better than the state average, taking in 64% of the Democratic vote. The NYC Election Atlas notes that she “did even better in the city’s predominantly African American and Afro-Caribbean communities in southeast Queens & the Rockaways, central Brooklyn (especially the Canarsie/East Flatbush area), & northern Bronx. She also did very well (70% or more of the vote) in Manhattan’s Upper East & West Sides and parts of lower Manhattan and Brooklyn Heights (predominantly white, liberal communities); as well as much of the rest of the Bronx.”
Sanders support concentrated in Greenpoint, Long Island City, Astoria, Breezy points and parts of Staten Island.
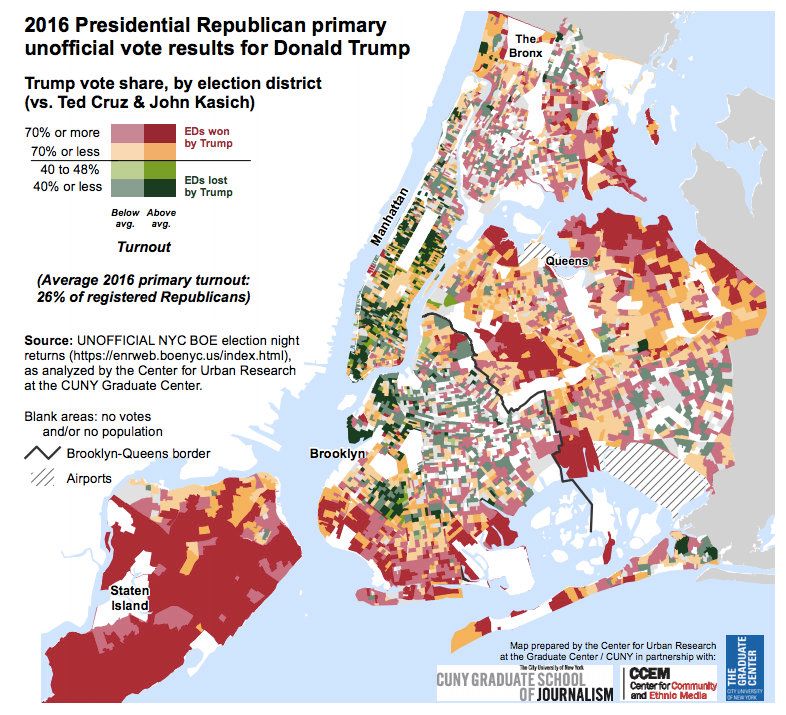
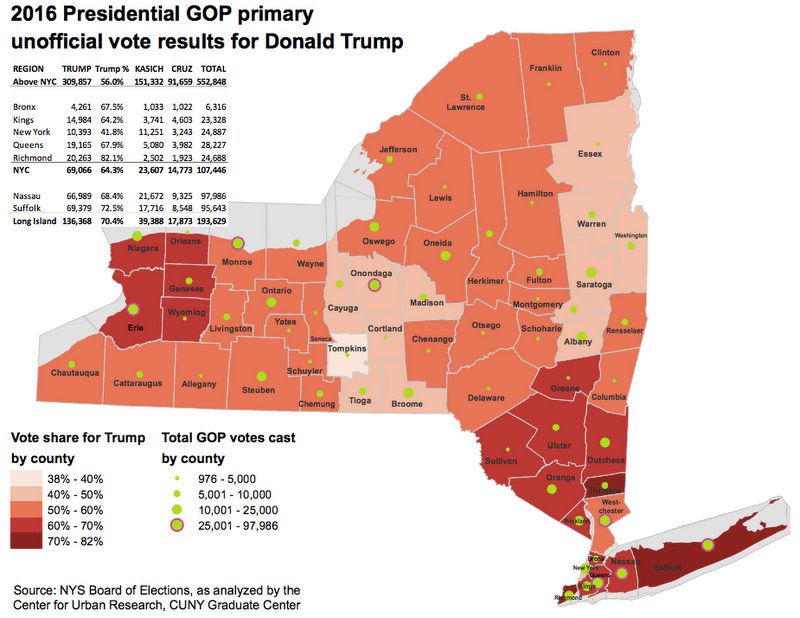
Meanwhile, 70,000 registered Republicans voted this year in the five boroughs of New York City. Of these, Trump took 63% of the votes. Still, the number of voting Republicans is up significantly from the last primary, when just 25,000 showed up at the polls. Manhattan is the only county Trump lost in New York State, resoundingly to John Kasich who took 45% of the vote.
In Staten Island, which we noted in our previous look at the NYC Election Atlas has a high concentration of Republican Voters, Trump received 82% of the 25,000 votes in the Republican Primary. The Election Atlas notes, that Trump “also received solid vote support in several predominantly white, conservative-leaning communities in Queens,” but not so much on Manhattan’s Upper East and Upper West, lower Manhattan, Park Slope in Brooklyn, and the Orthodox community (whose votes went to Ted Cruz).
Here are the results state wide by county:
And just to recap the overall results: Hillary Clinton won the Democratic Primary with 58% and more than a million votes, taking 139 delegates. Bernie Sanders had 42% of the vote and 108 delegates, but there were voter issues on the Democratic side – 125,000 to 140,000 Democratic voters were dropped since November 2015 without an “adequate explanation,” said New York City comptroller Scott Stringer who announced that his office would perform an audit on the Board of Elections. On the Republican side, Trump took over 60% of the vote and 89 delegates in the headed race to the convention.
Map of voters that were “dropped”:
View larger mapNext, check out New York City’s party affiliation mapped. See more from the NYC Election Atlas.
